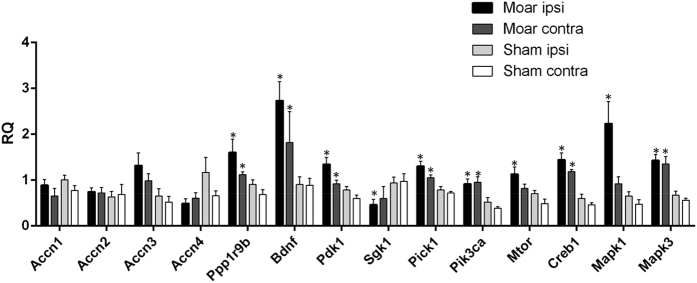
Figure 5. Gene expression profiling in the amygdala.
Relative quantity (RQ) histogram of the transcripts differentially expressed in the ipsilateral and contralateral basolateral complex of the amygdala between sham and MoAr rats assessed using TLdA. *p ≤ 0.05 between the RQ of the ipsi or contra MoAr groups respective to the sham side (i.e., ipsi or contralateral sides respectively (non parametric Kruskall-Wallis test)). n = 6 per group (in duplicate).

