
FIGURE 4.
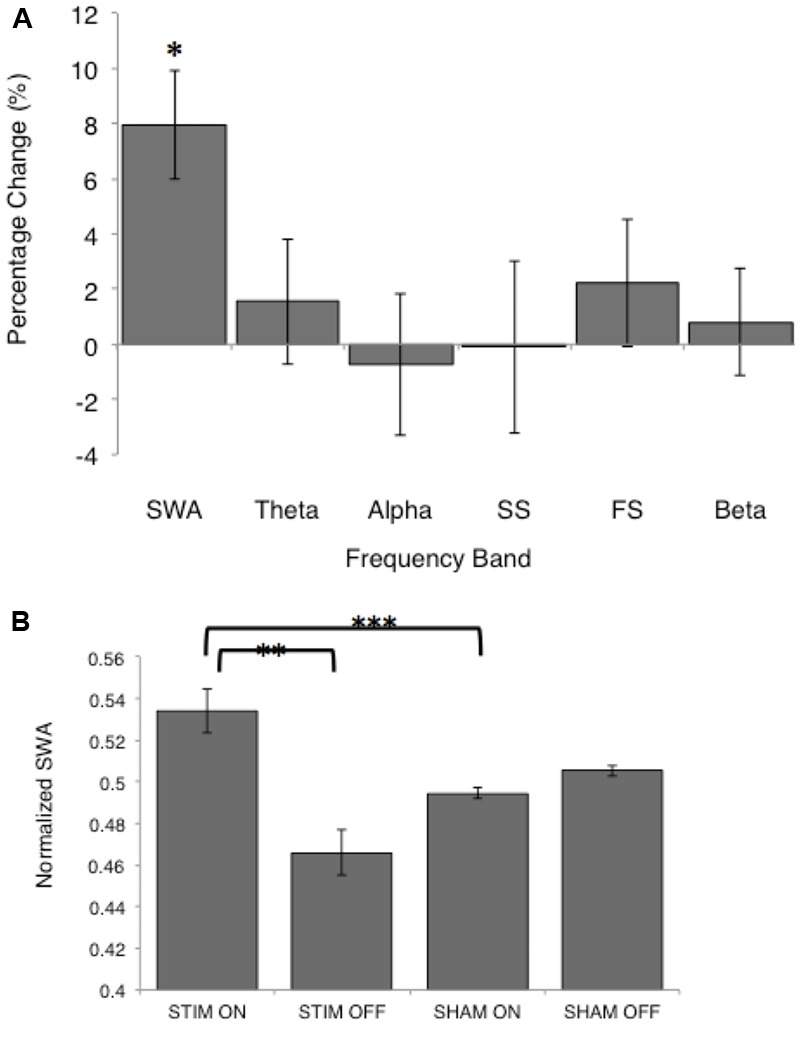
Normalized spectral power for the STIM and SHAM periods. (A) Percentage change from the SHAM ON to the STIM ON condition for SWA (>0.5–4 Hz), theta (>4–8 Hz), alpha (>8–12 Hz), slow spindle (SS, >11–13 Hz), fast spindle (FS, >13–15 Hz), and beta (>16–20 Hz) frequency bands. The change in SWA was significantly increased following STIM compared to SHAM (∗p = 0.006). (B) SWA for the STIM and SHAM, ON and OFF intervals. ∗∗p = 0.006, ∗∗∗p = 0.002 for paired t-tests.