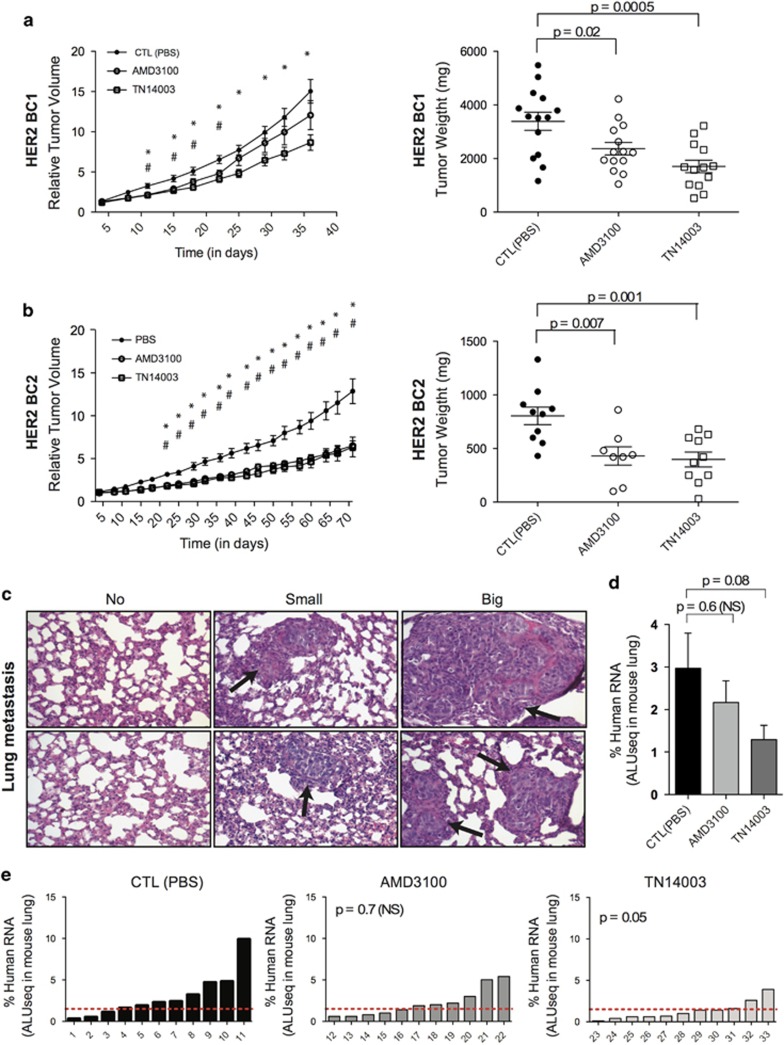
Figure 2.
CXCR4 inhibitors reduce tumor growth and pulmonary metastasis formation in HER2 BC PDX. (a and b) Tumor growth curve (variation of tumor volume as a function of time, Left) and final tumor weight (Scatter plots, Right) of HER2-BC1 (a) and HER2-BC2 (b) PDX models (mg: milligrams). Mice were treated with PBS (CTL, Control) (•), AMD3100 (○) or TN14003 (□). Data are means±s.e.m (N⩾10 per group). P-values are from Student's t-test, where # and * represent significant P-values (P⩽0.05) between CTL(PBS)- and AMD3100-treated mice or between CTL(PBS)- and TN14003-treated mice, respectively. (c) Representative views of lung tissues from HER2-BC1 PDX stained by Haematoxilin and Eosin coloration showing absence (Left) or presence of small- (Middle) and large-sized (Right) pulmonary metastases. (d) Quantification of lung metastases by detecting human-specific ALU sequences in RNA extracted from lungs of HER2-BC1 PDX mice treated with PBS (CTL), AMD3100 or TN14003, as indicated. Pulmonary metastases are quantified at the final time point of tumor growth. Data are means±s.e.m (N⩾10 per group). P-values are from Mann–Whitney test. (e) Quantification in each mouse of lung colonization by tumor cells. N=11 tumors for each condition. Numbers below each bar graph represent the tag number of each mouse. P-values are from Fisher's test considering mice harboring low (Meta<1.5), middle (1.5<Meta>4) or high (Meta>4) pulmonary metastatic content after treatment (AMD3100 or TN14003) compared with controls (CTL, treated with PBS).

