
FIG 2 .
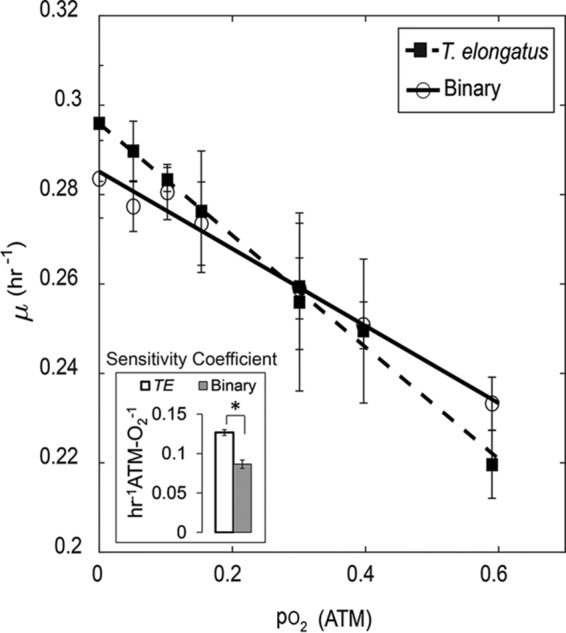
Oxygen inhibition profiles of steady-state specific growth rates controlled under increasing oxygen tensions (pO2 of in-gas). The absolute value of the slopes represents the sensitivity coefficients which are inversely proportional to the growth resistance to O2 stress for each culture. The sensitivity coefficients were determined to be 0.127 ± 0.004 and 0.086 ± 0.005 (± standard error) for the T. elongatus axenic (TE) and binary (Binary) cultures, respectively. Each data point represents the average of measurements taken every minute over a minimum of three reactor residence times held under each respective steady state. Error bars represent ±1 standard deviation. *, significant differences with >99% certainty as determined by t test of unequal sample sizes, assuming equal variance.