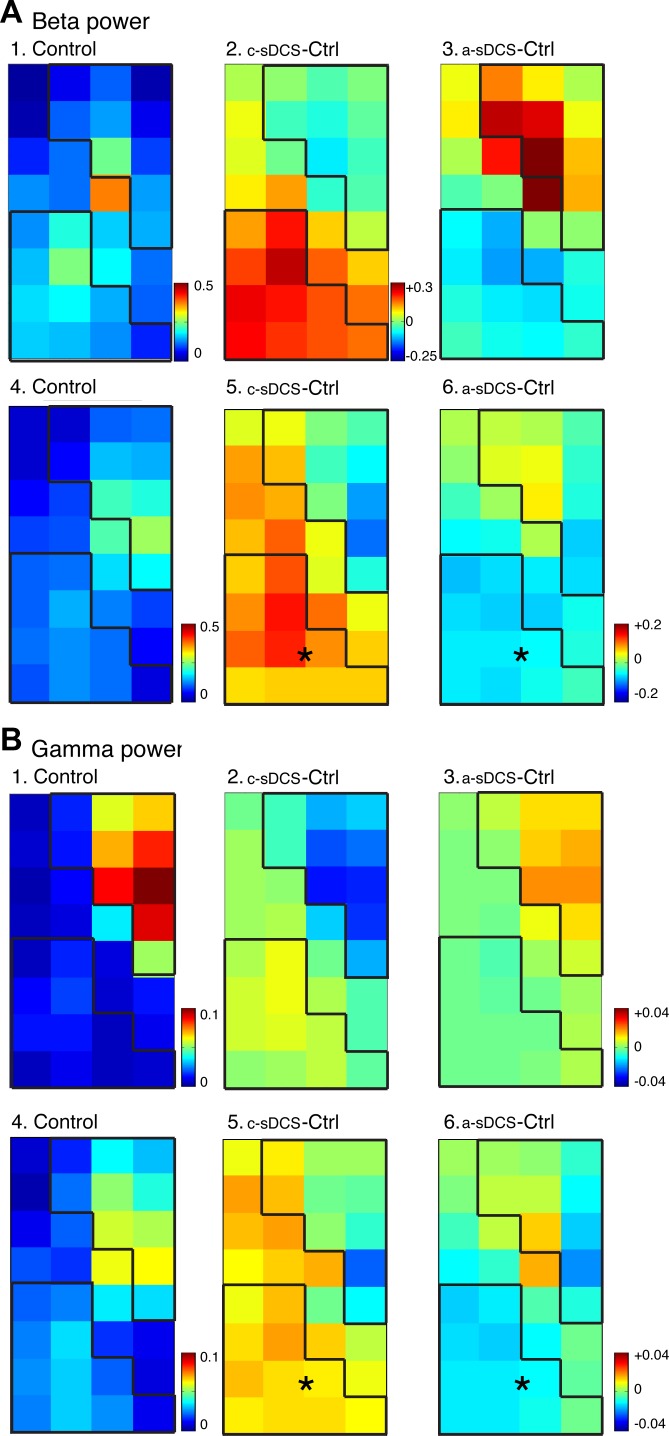
Fig. 3.
Topographic effects of sDCS on spinal oscillations evoked by M1 electrical stimulation in the β- (A) and γ-ranges (B). Top rows for A and B show data from a representative animal, and the bottom rows show averaged data (n = 5 rats). A1: control map of β-oscillation power. A2 and A3: changes induced by c-sDCS and a-sDCS, respectively. A4: average control map of β-oscillation power. A5 and A6: average maps of changes induced by c-sDCS and a-sDCS, respectively. B: same as A but for γ-band oscillations. Calibrations: A1, 4. 0–0.5 mV2/Hz; A2 and A3, −0.25 to +0.3 mV2/Hz; A5 and A6, −0.2 to +0.2 mV2/Hz; B1, 4. 0–0.1 mV2/Hz; B2, B3, B5, and B6, −0.04 to +0.04 mV2/Hz. *Significant changes from control in the ROIs.

