Fig. 5.
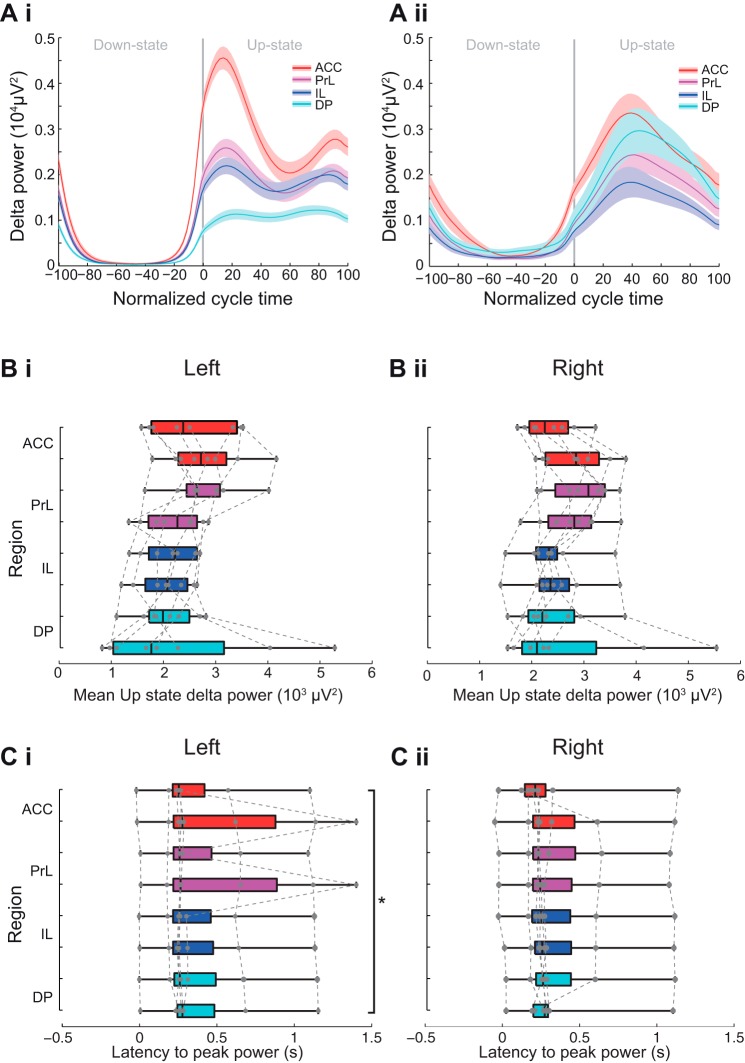
Subregional profile of Up-state delta-frequency oscillation power and latency. Ai and Aii: 2 different examples of delta power across the normalized slow oscillation cycle. Solid line shows means ± SE (shaded region) over all cycles in the analyzed data segment from 2 different animals (regions color coded as indicated in the schema in Fig. 3B). Boxplot showing subregional profile of mean Up-state spindle-frequency power in the left (Bi) and right (Bii) hemisphere (gray dots show individual data points). Boxplot showing subregional profile of peak Up-state delta-power latency in the left (Ci) and right (Cii) hemisphere (gray dots show individual data points).

