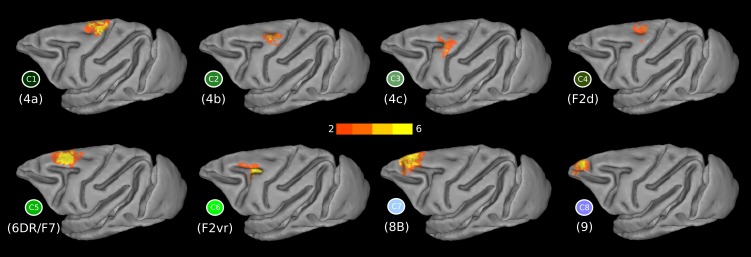
Fig. 5.
Probabilistic maps of the dorsal LFC clusters and their respective functional connectivity (FC) maps. Colors from orange to yellow in the probabilistic maps denote low to high overlap across animals. The faded colored borders correspond to the dorsal clusters as depicted in the winner-takes-all map in Fig. 3B.

