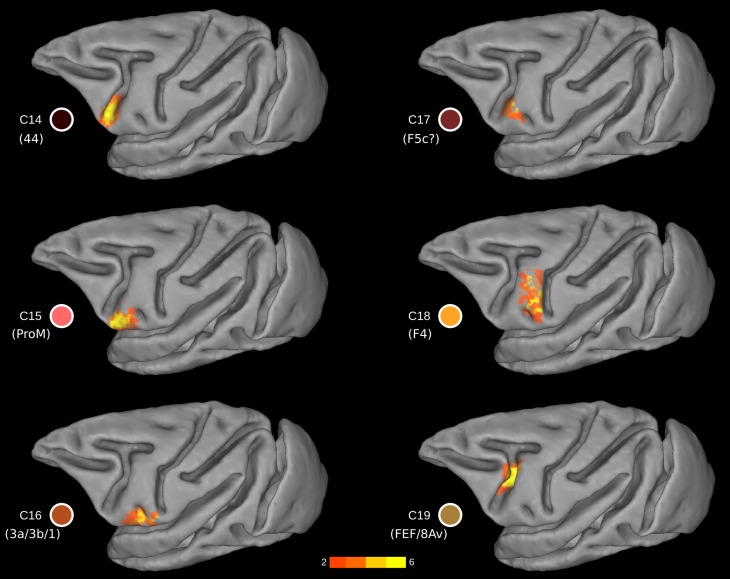
Fig. 7.
Probability maps for each ventral LFC cluster. The probability maps are thresholded to include part of the cluster present in at least 2 animals. The color of the clusters corresponds to the color-coding scheme of Fig. 3B. Yellow (orange) colors denote high (low) probability, i.e., presence across animals.

