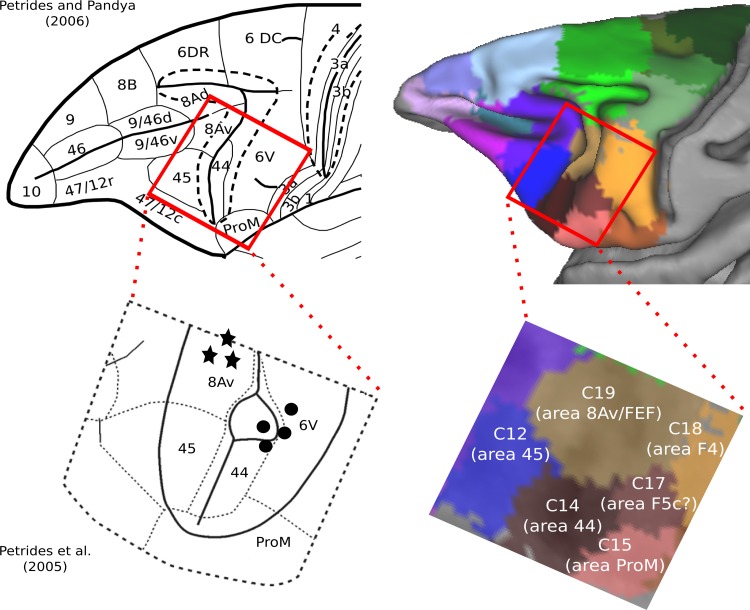
Fig. 9.
Cytoarchitectonic maps of motor and premotor cortical areas. The red box represents the zoomed images of the inferior arcuate sulcus region at bottom. The circles and stars represent approximate locations of orofacial and oculomotor neurons, respectively, as identified by intracortical stimulation (Petrides et al. 2005). Note that the oculomotor and orofacial neurons correspond to distinct connectivity-based clusters identified as putative areas 8Av/FEF and area 44, respectively. Map at top left was modified with permission from Petrides and Pandya (2006). Map at bottom left was adapted by permission from Macmillan Publishers Ltd: Nature, Vol. 435, Petrides M, Cadoret G, and Mackey S, Orofacial somatomotor responses in the macaque monkey homologue of Broca's area, Pages 1235–1238, copyright 2005.

