
Fig. 5.
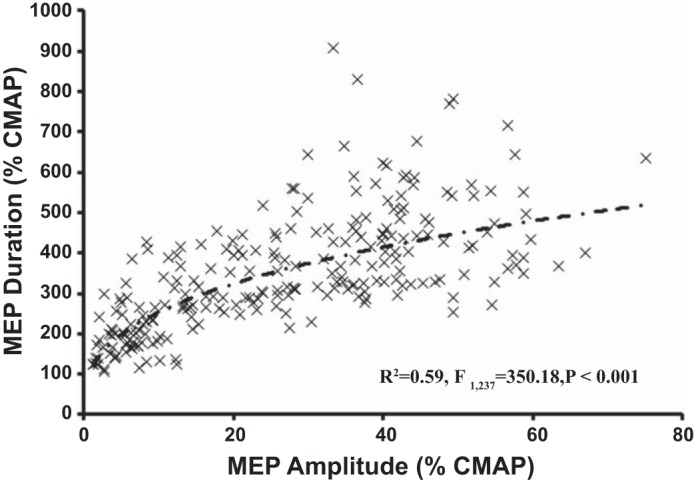
Relationship between the motor-evoked potential (MEP) duration, expressed as a percentage of the compound muscle action potential (CMAP) duration, and MEP amplitude. Each data point represents an averaged MEP duration and amplitude value for a specific level of stimulus intensity and muscle activation state in each individual. The dashed line represents the optimal curvilinear model.