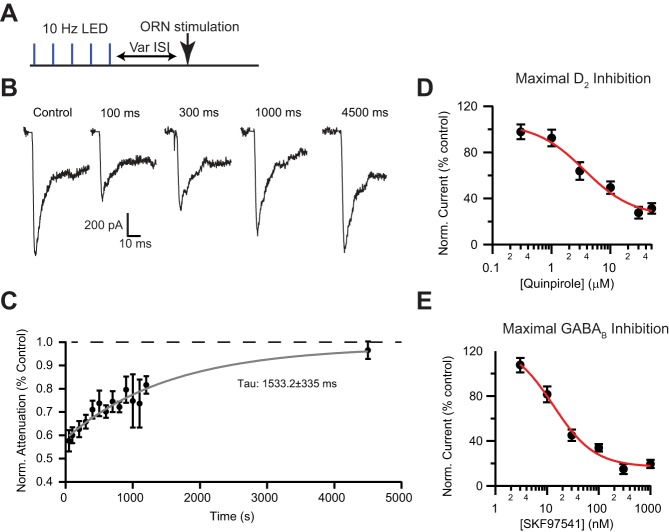
Fig. 3.
Time course of endogenous inhibition and maximal pharmacological inhibition. A: optogenetic stimulation protocol: 5 LED pulses at 10 Hz followed by ORN stimulation at various intervals (50–4,500 ms). B and C: time course of attenuation by optogenetic stimulation of short axon cells. Inhibition was maximal at the shortest intervals tested (50 ms) and recovered with a single exponential with a time constant (τ) of 1,533.2 ± 335 ms. Attenuation recovered to baseline levels by ~4,500 ms. D: pharmacological inhibition of afferent input by the D2 agonist quinpirole at various concentrations. E: pharmacological inhibition of afferent input by the GABAB agonist SKF97541.

