
Fig. 1.
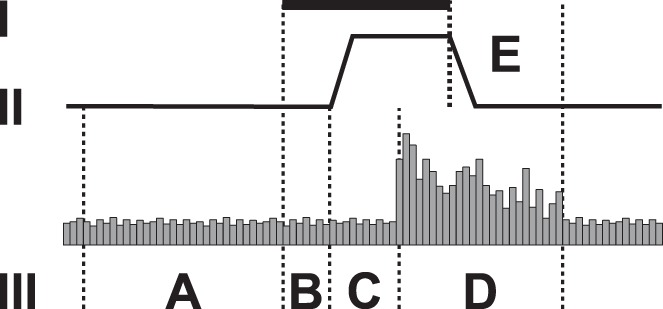
Measurements in recordings of neuronal responses, Traces I-III. I: duration of S2 stimulation (15 s). II: temperature of the heat stimulus (baseline 35°C, peak temperature 53°C). III: peristimulus time histogram of the heat-evoked neuronal discharge. Intervals A–E. A: ongoing mean discharge rate. B: mean discharge rate during S2-stimulation. C: latency to heat-evoked burst discharge. D: duration and mean rate of the heat-evoked burst discharge. E: duration and rate of the late heat-evoked burst discharge. In RVM recordings, electric noise induced by S2 stimulation prevented assessing intervals B, C, and D, but C and D were assessed in the post-S2 condition. In RVM recordings, measurements “during S2” were performed in interval E.