FIGURE 5.

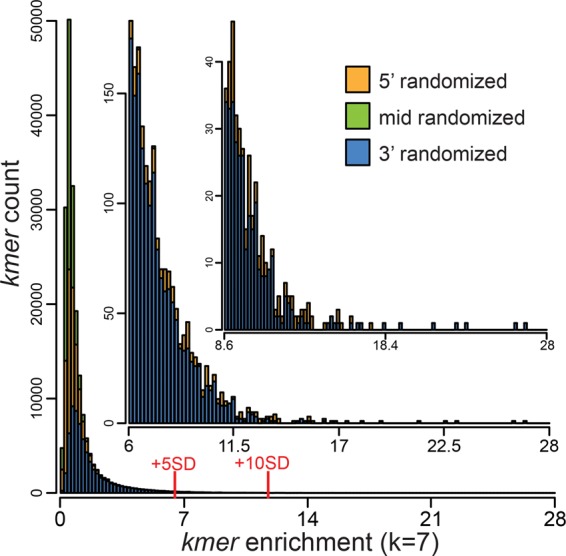
Frequency distribution of 7-mer enrichment values in the PPR10 bind-n-seq experiment. Enrichment values were calculated for each 7-mer at each position as the frequency of that 7-mer in the bound fraction divided by its frequency at the same position in the input library. The graph shows the number of different 7-mers (y-axis) at each enrichment value (x-axis). 7-mers from the 5′-, 3′-, and middle-randomized pools are colored in orange, blue, and green, respectively. Insets show expansions of the data in the tail of the distribution. The subsets of 7-mers that were enriched more than 5 or 10 standard deviations above the mean are marked. Analogous plots for the PPR10 variants that were analyzed by bind-n-seq are shown in Supplemental Figure S2. The frequency distribution of 7-mers in the input pool is plotted in Supplemental Figure S1C.
