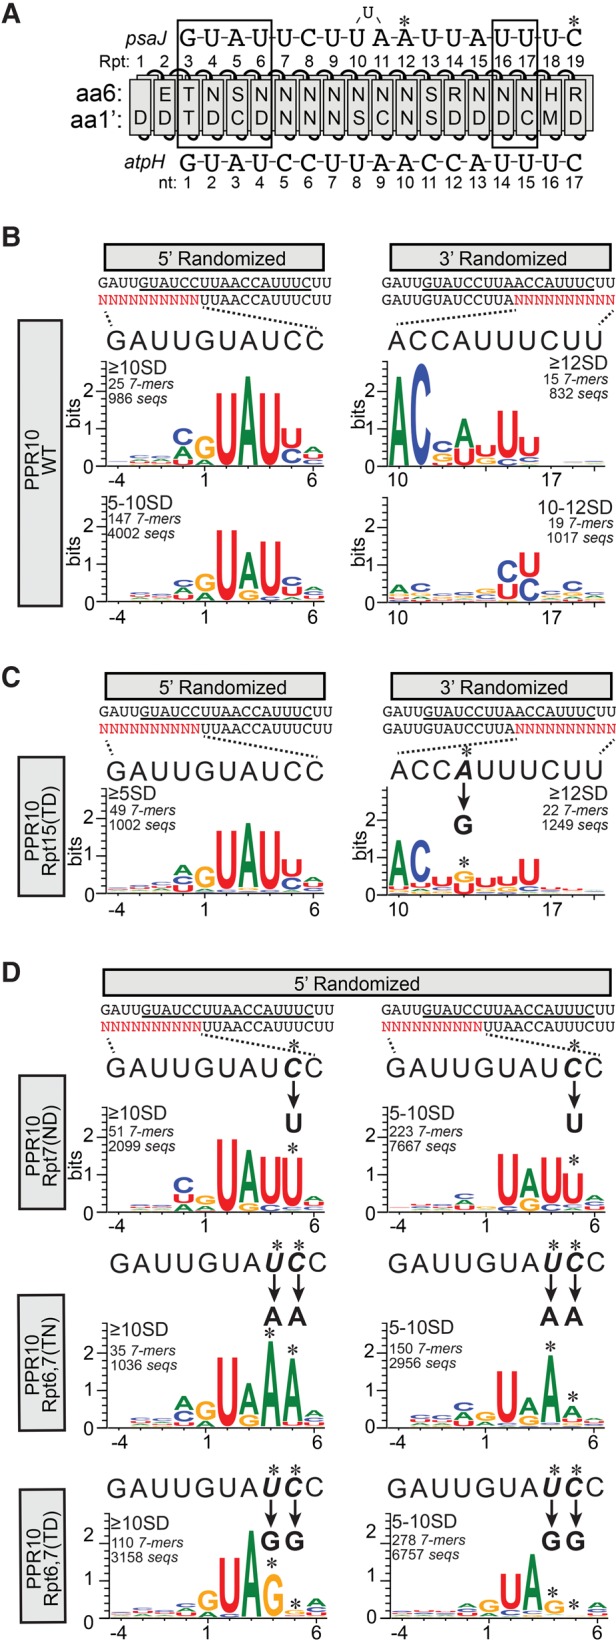
FIGURE 6.

Sequence logos representing sequences harboring 7-mers that were enriched in PPR10 bind-n-seq assays. (A) Diagram of PPR10 aligned with its native atpH and psaJ binding sites. The protein and RNAs are annotated as in Figure 1. (B) Sequence logos representing data from the bind-n-seq assay with wild-type PPR10. Analyses of data from the 5′ and 3′ randomized pools are shown on the left and right, respectively. The oligonucleotide with the randomized region (in red) is displayed beneath the sequence of PPR10's footprint (minimal PPR10 binding site underlined). The wild-type sequence corresponding to each randomized region is expanded above the logos to facilitate comparisons. Position 1 is defined as the start of the minimal atpH binding site based on the register imposed by the constant region of each oligonucleotide. The enrichment cutoffs of the 7-mers used to generate each logo (in standard deviations above the mean), the number of different 7-mers in that subset, and the number of different sequences in that subset are indicated. (C) Sequence logos representing data from PPR10 variant Rpt15(TD). Logos are annotated as described in panel B. The change in sequence specificity predicted by the PPR code for the Rpt15(TD) variant is indicated, and the corresponding position in the logo is marked with an asterisk. (D) Sequence logos representing data from PPR10 variants Rpt7(ND), Rpt6,7(TN), and Rpt6,7(TD). Logos are shown only for data from the 5′ randomized oligonucleotide, which is the region expected to interact with the modified repeats. No substantive differences from the wild-type were observed in the sequences selected from the 3′ region. Logos are annotated as in panel B.
