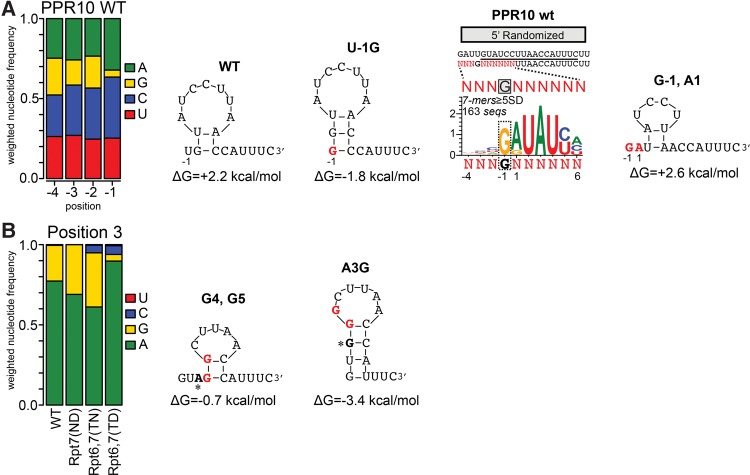
FIGURE 8.
Sequence covariations in the bind-n-seq data illustrate the inhibition of PPR10 binding by RNA secondary structure. RNA structures were predicted by M-fold (Zuker 2003). (A) Basis for selection against G at position −1. The bar graph shows the representation of each nucleotide at each indicated position in sequences harboring 7-mers that were enriched in the WT PPR10 assay (≥5 SD above the mean). Frequencies are weighted by the enrichment value of the corresponding sequence. The subset of these sequences harboring G at position −1 was used to generate the sequence logo to the right. The impact of various nucleotide identities at positions 1 and −1 on RNA structure are diagrammed, with nucleotides that differ from the WT site highlighted in red. (B) Basis for selection against G at position 3 by PPR10 variant Rpt6,7(TD). The bar graph shows the representation of each nucleotide at position 3 among sequences harboring enriched 7-mers (≥5 SD above the mean) in bind-n-seq assays with the indicated proteins. The structures predicted for the preferred Rpt6,7(TD) binding site and for the A3G substituted site are diagrammed, with nucleotides that differ from the WT sequence highlighted in red and position 3 indicated by an asterisk.

