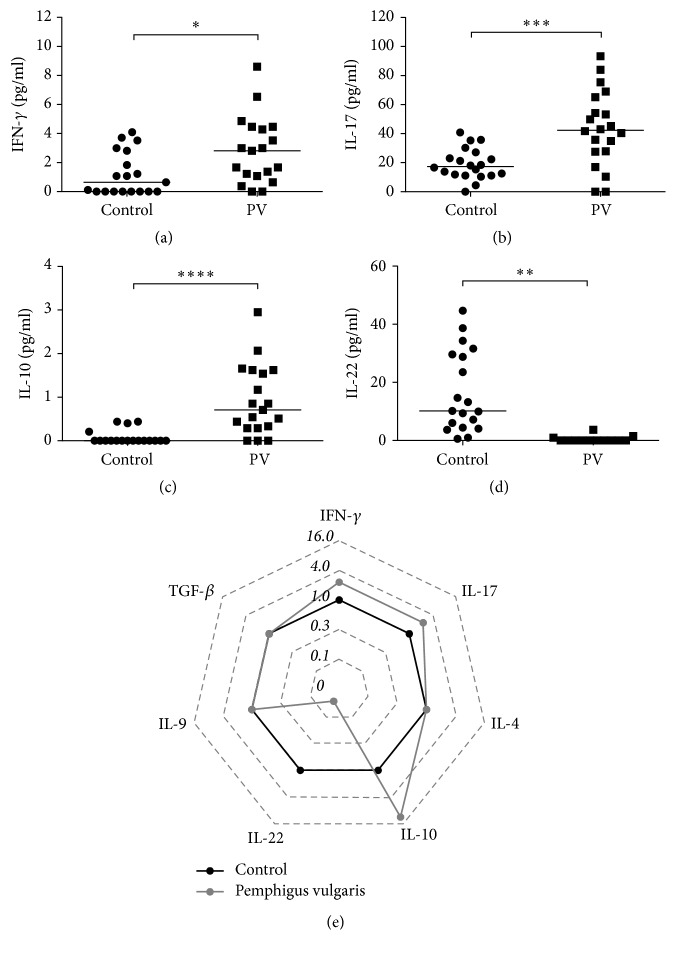
Figure 1.
Serum profile of T cell-derived cytokines in Pemphigus vulgaris. Levels of (a) IFN-γ, (b) IL-17, (c) IL-10, and (d) IL-22 in Healthy Donors (⬤) and Pemphigus vulgaris patients (■). Error bars represent median ± SD. ∗p < 0.05; ∗∗p < 0.01; ∗∗∗p < 0.001; ∗∗∗∗p < 0.0001; Mann–Whitney test. (e) Radar plot representation of serum T cell-derived cytokine profile. The lines highlight the fold change in cytokine levels in Pemphigus vulgaris patients (gray line) in relation to Healthy Donors (black line). Data were obtained by calculating the ratio between the median concentration of each cytokine in the Pemphigus vulgaris group and in the healthy group.

