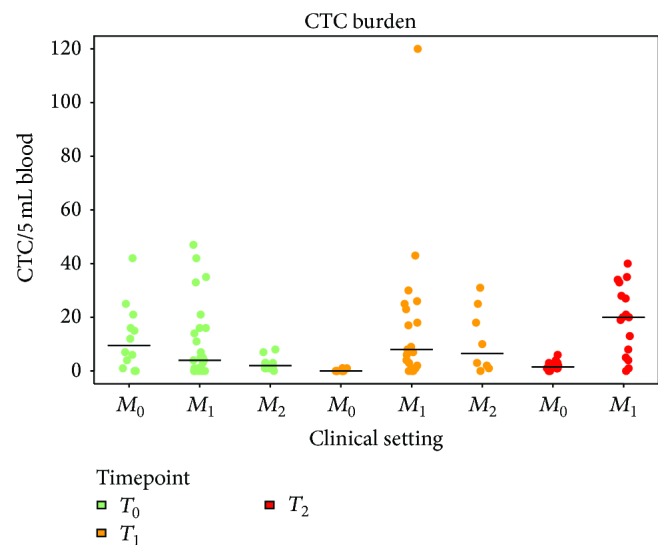
Figure 3.

Circulating tumour cell (CTC) distribution in the different clinical settings. The number of CTC per 5 mL of blood, detected by ScreenCell approach, is reported for each clinical setting (patients with muscle-invasive nonmetastatic bladder cancer, M0; patients with M+ bladder cancer, under first-line, M1, or second-line, M2, therapy) at each time point analyzed: baseline (T0, green dots), after the first (T1, yellow dots), and after the second (T2, red dots) cycle of therapy.
