Figure 1.
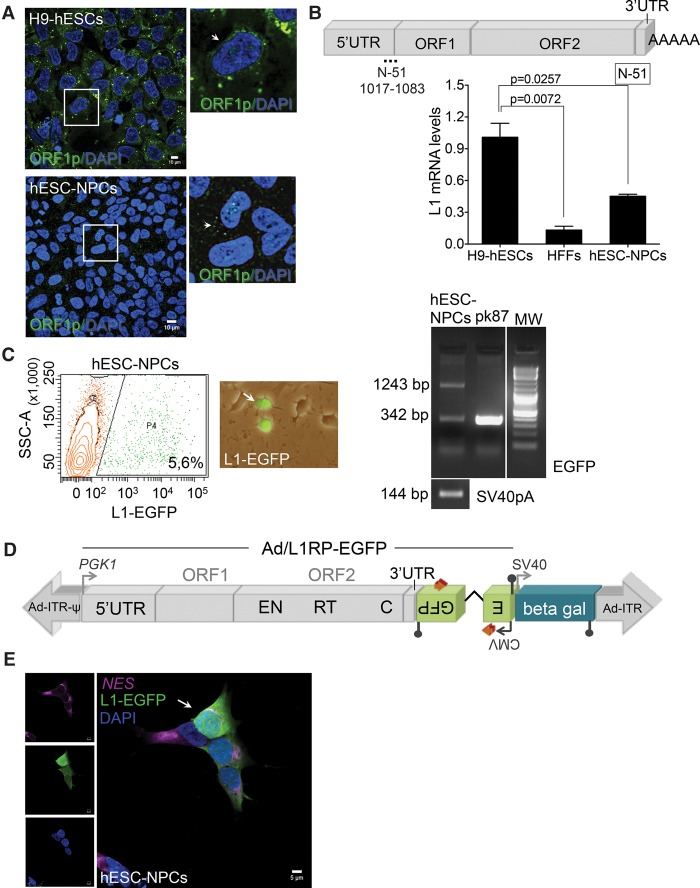
LINE-1 retrotransposition in human neuronal progenitor cells. (A) Confocal analyses of L1-ORF1p expression in H9-hESC (top) and H9-hESC-derived NPCs (bottom). A merged image of nuclear DNA stained with DAPI (blue) and L1-ORF1p staining (green) is shown. An enlargement of a portion of the image is shown at the right; (scale bars) 10 µm. (B) L1Hs mRNA expression analyses by RT-qPCR. A cartoon of an active L1Hs element is shown, in which the relative positions of the 5′ UTR, ORF1, ORF2, and 3′ UTR sequences are indicated. Also indicated is the relative position of the primer pair used to analyze L1 expression (N-51 pair). The numbering refers to the nucleotide sequence of L1.3 (Sassaman et al. 1997). The bar graph shows expression data in the indicated sample (n = 3 biological replicas). The expression level of H9-hESCs was designated 1 for comparison. Also indicated is the significance of the statistical method applied (one-way ANOVA with Tukey, P-value 0.0257 and 0.0072) and SEM (Methods). (C) Representative retrotransposition results in hESC-derived NPCs 7 d post-transfection using plasmid 99-gfp-LRE3 (Supplemental Fig. S1E). A FACS histogram plot (SSC-A versus EGFP, the percentage of EGFP-expressing cells is indicated, in triplicate) and a merged image (bright field/EGFP) of transfected NPCs with plasmid 99-gfp-LRE3 are shown. The rightmost panel contains results from the PCR intron assay. pk87 cells (Garcia-Perez et al. 2010) were used as a positive amplification control of spliced L1-EGFP. The amplification of a portion of the SV40 polyadenylation sequence was used as a control (present in the transfected plasmid) (Supplemental Fig. S1E, black lollipop). (D) Rationale of the retrotransposition assay using the Ad-L1 virus: (gray arrows) exogenous promoters (PGK1, upstream tagged L1; SV40, beta-gal; CMV, EGFP); (blue box) independent beta-gal expression cassette; (Ad-ITR) inverted terminal repeats of human adenovirus type 5; (ψ) packaging signal. With this configuration, expression of EGFP can only be activated after a round of retrotransposition (Supplemental Fig. S1E). (E) Representative retrotransposition assays using the Ad-L1 in hESC-derived NPCs. A merged image of Ad-L1-infected NPCs analyzed 3 d after infection and stained with antibodies against NES (pink) and EGFP (green) is shown; nuclear DNA was stained with DAPI (blue). The left side contains the captured images used in the merged image; (white bars) 5 µm.

