Figure 3.
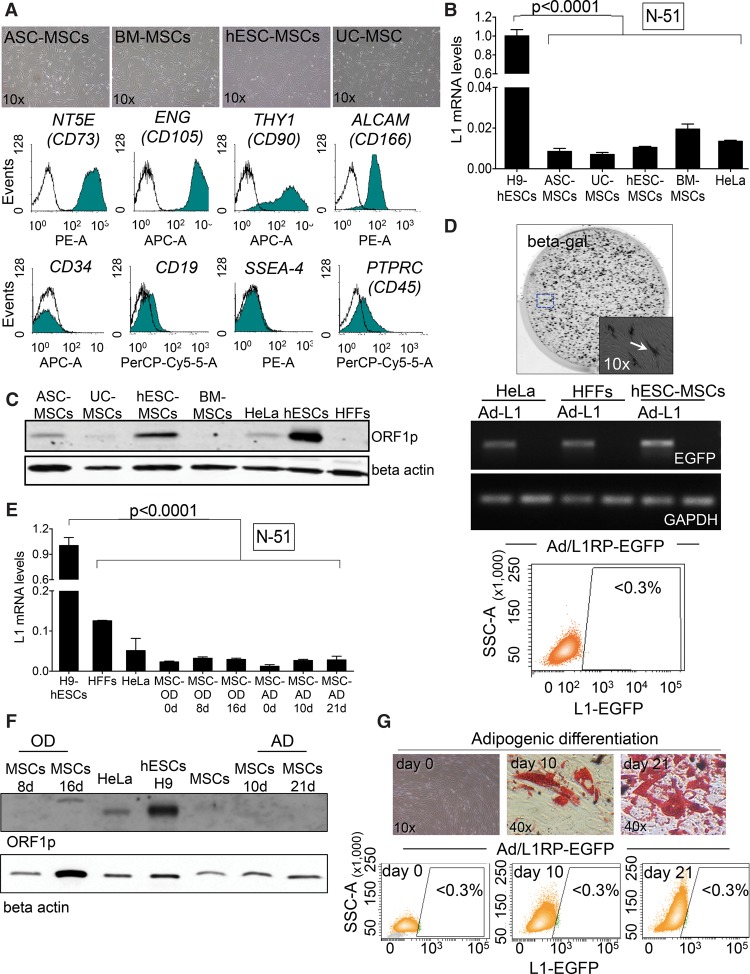
LINE-1 retrotransposition in mesenchymal stem cells. (A) Representative bright field images of cultured MSCs isolated from the indicated tissue/cell type. FACS histograms acquired in pooled MSCs for NT5E, ENG, THY1, ALCAM, PTPRC, CD34, CD19, and SSEA4 are shown below. (B) L1Hs mRNA expression analyses by RT-qPCR in MSCs. The graph shows expression data in the indicated sample (n = 3 biological replicas), the SEM, and the significance of the statistical method (one-way ANOVA with Tukey, P-value < 0.0001). (C) Western-blot analyses of L1-ORF1p in the indicated cell type (above each lane). Beta actin is used as a loading control. (D) L1-retrotransposition in MSCs using Ad-L1. An image from a representative infection of MSCs with Ad-L1 and stained for beta-gal 3 d post-infection is shown. An enlarged region is also shown in the bottom-right corner. In the middle, RT-PCR analyses for EGFP and GAPDH on the indicated cell type. Cells were either infected (Ad-L1 lanes) or incubated with 1×PBS (nonlabeled lanes). The bottom panel shows a representative FACS histogram acquired from Ad-L1 infected MSCs 7 d post-infection. The percentage of EGFP-expressing cells is indicated as determined in triplicate. (E) L1Hs mRNA expression analysis in differentiating MSCs as measured by RT-qPCR (SEM is indicated; n = 2 biological replicas). Statistical method applied is one-way ANOVA with Tukey, P-value <0.0001. (F) Western-blot analyses of L1-ORF1p expression in the indicated cell type (above each lane). Beta actin was used as a loading control. (G) L1-retrotransposition in differentiating MSCs using Ad-L1. The top shows representative images of Oil Red O staining at the indicated time after the initiation of MSC differentiation. The bottom contains representative FACS histograms that indicate the percentage of EGFP-expressing (triplicate) at the indicated time.

