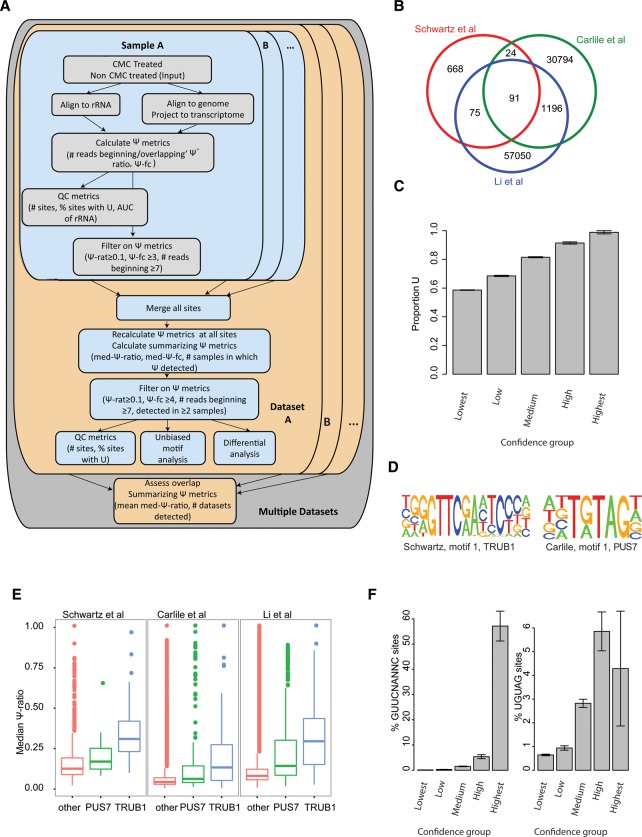
Figure 1.
Detection and sequence analysis of Ψ sites across experimental data sets. (A) Scheme outlining computational approach for detection and integration of Ψ sites from multiple samples and data sets. For each sample pair, consisting of CMC-treated and untreated (input) samples in a specific data set, genomic mappings of reads are first cast onto transcriptome coordinates, following which a set of Ψ metrics is computed for each site, comprising the total number of reads terminating and overlapping the site in the input and treated samples, the Ψ-ratio (# terminating/# overlapping) for each of the samples, and the Ψ fold-change (Ψ-ratio treated/Ψ-ratio untreated). Sites surpassing thresholds in terms of coverage, Ψ-ratio and Ψ fold-change are flagged as putative Ψ sites. In parallel, QC metrics for the sample pair are derived, the most informative of which we found to be (1) area under the ROC curve (AUC) values capturing the trade-off between sensitivity and specificity when overlapping the ranked set of detected sites (ordered based on Ψ-ratio) in the 18S rRNA with the known set of modified sites, and (2) % of putative pseudouridylated sites harboring a U at detected site. For each data set (harboring multiple sample pairs), all sites detected in any of the positions are first concatenated, following which Ψ metrics are recalculated for all sites across all samples, in addition to summarizing metrics including the median Ψ-ratio and the number of samples in which evidence for pseudouridylation exists. Stringent filters are applied at this level, to identify sites that are reproducibly identified at high Ψ levels. (B) Venn diagram showing extent of overlap between detected sites across the three analyzed data sets. (C) Fraction of putative Ψ sites harboring a U at the detected position (y-axis) plotted as a function of confidence group, capturing both the number of samples and data sets in which the putative position was detected. The fraction of sites not harboring a U is considered a lower bound on the false detection rate. (D) Sequence logos of the top motifs identified in the Schwartz et al. and Carlile et al. data sets are depicted. (E) Median Ψ-ratios for sites harboring a PUS7, TRUB1, or other motif across the three data sets. (F) Fraction of putative pseudouridylated sites comprising a TRUB1 (left) and PUS7 (right) motif, plotted for each confidence group (see panel C).

