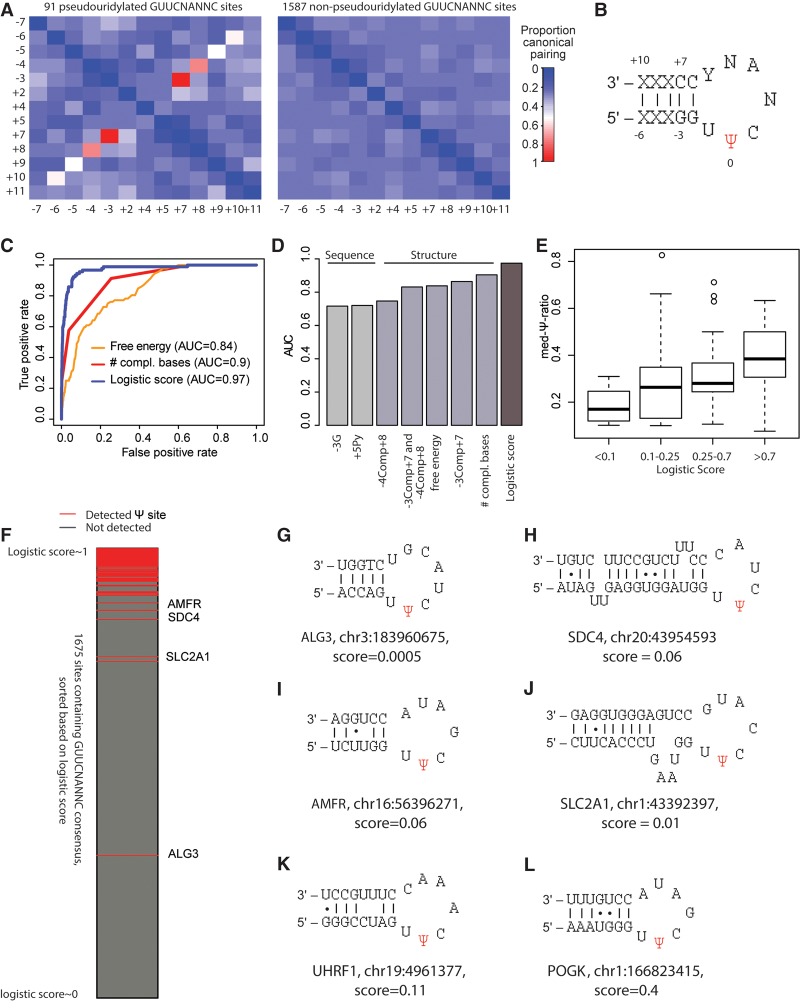
Figure 2.
Characterization and modeling of TRUB1 sites. (A) Heat map depicting proportion of sites comprising a TRUB1 consensus sequence in which the indicated pairs of positions (labeled with respect to the Ψ position) are complementary to each other. This analysis was performed separately for 92 sites harboring a GUUCNANNC motif with evidence of pseudouridylation in HEK293 cells (Methods) and for 1587 control sites harboring the same consensus sequence but lacking evidence of pseudouridylation. Only varying positions are depicted, hence excluding positions −2, −1, 0, 1, 3, and 6. (B) Hairpin predicted to form based on complementarity identified in A. (C) Receiver-operator curves (ROCs) for distinct models predicting the likelihood of a site being a TRUB1 substrate based either on predicted free energy of secondary structure calculated for a sequence of 24 bases surrounding the putative Ψ site, the number of complementary bases in the stem (a value from 1 to 4), or a linear combination of all of the features shown in D. (D) Area under the ROC curve (AUC) values shown for prediction of pseudouridylation status based on indicated features. (E) Distribution of Ψ-ratios across four classes of sites, divided according to the logistic regression-based probability of being pseudouridylated. (F) All 1679 TRUB1 consensus-containing sites with sufficient coverage are ranked based on their logistic score and color-coded as indicated based on whether pseudouridylation was detected experimentally. (G–L) Predicted secondary structure of indicated sites that harbor a TRUB1 consensus sequence and are reproducibly detected as pseudouridylated, yet obtain very low logistic regression-based scores of undergoing pseudouridylation. Canonical base pairs are joined by a line; noncanonical G-U pairs are joined by a dot.

