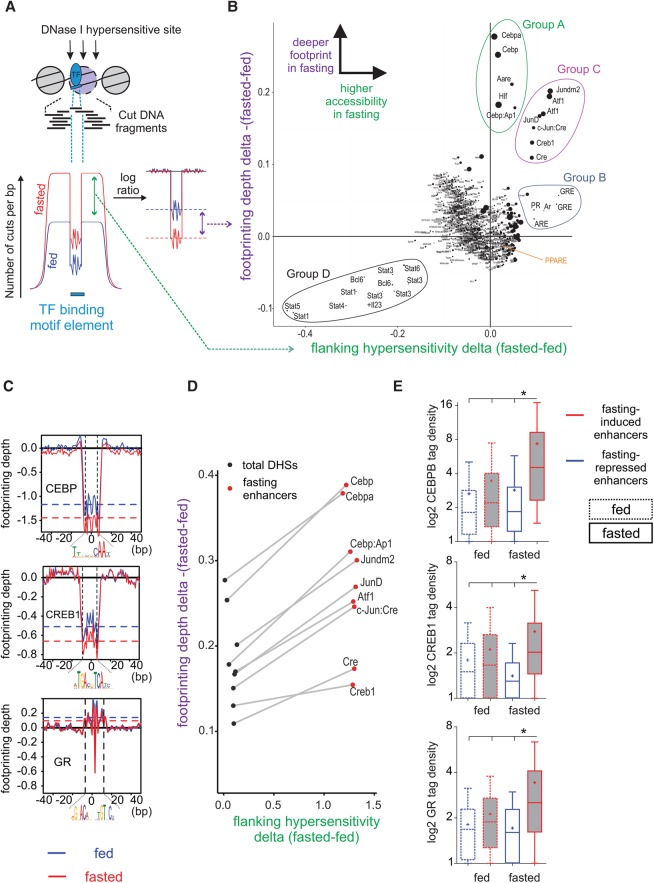
Figure 2.
An unbiased method for detecting differences in footprinting depth and motif-flanking accessibility reveals the key TFs that bind at fasting-induced enhancers following fasting. (A,B) The number of DNase I cuts (i.e., “cut count”) is collected at and around a motif (±100 bp from motif center) in all motif occurrences within DHS sites. This cut count profile is then compared between the fed and fasted conditions, and a delta value is given for each motif (x-axis in the scatter plot). Then, a log ratio between the observed and expected (due to DNase I cut bias) cut counts at the motif is calculated. This ratio is normalized to provide a reliable footprint depth value that is unaffected by surrounding hypersensitivity (Methods). The delta value between footprint depth in the fasted and fed conditions is then given for each motif (y-axis in the scatter plot). The bigger the size of the circle marking the motif, the deeper the footprint is in the fasted state. Cut count data for B were pooled from three replicates. When single replicates were used, the observed pattern was similar (Supplemental Fig. S1D). (C) Individual normalized footprint depth aggregate plots for the CEBP, CRE, and GRE motifs. Footprint depth is illustrated with horizontal dashed lines: (red) fasted; (blue) fed. (D) Scatter plot depicting changes in footprint depth and hypersensitivity of fasting-related motifs in total liver DHS sites compared to fasting-induced enhancers. (E) Extent of CEBPB, CREB1, and GR binding (measured by ChIP-seq tag density) at fasting-responsive enhancers in liver following fasting (24 h).

