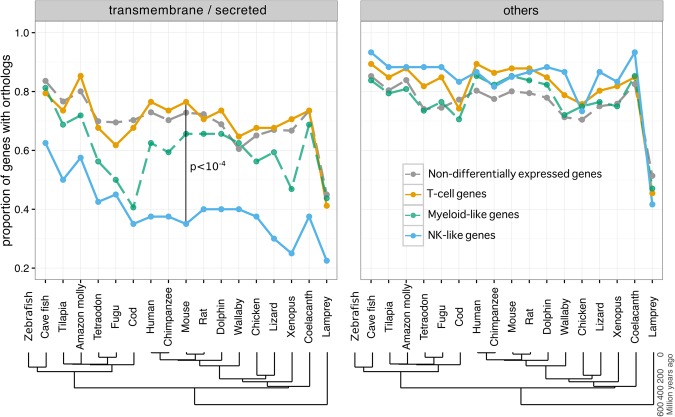
Figure 5.
Conservation analysis of zebrafish immune genes across vertebrates. The proportion of orthologs of protein-coding genes for nondifferentially expressed genes (gray), differentially expressed genes in T cells (orange), NK-like cells (blue), and myeloid-like cells (green) are shown for both TM or secreted proteins (left) and other proteins (right).

