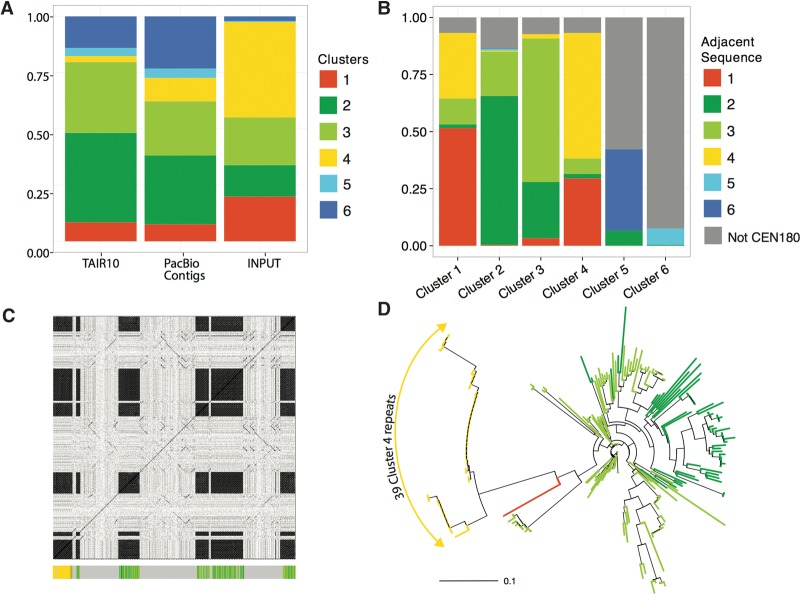
Figure 2.
Distribution of CEN180 clusters in genome assemblies. (A) Stacked proportional bar graph representing relative abundance of each cluster in the TAIR10 reference genome, PacBio contigs, and ChIP input from wild-type Col-0 genetic background. (B) Stacked bar graph illustrating the sequences found adjacent to repeats by cluster. (C) Dot plot of PacBio contig JSAD01000006.1 against itself illustrating four blocks of CEN180 tandem repeats. The colored bar graph running along the x-axis highlights the 219 repeats identified on this contig using the LASTZ search method. (D) Phylogenetic tree of repeats identified in the contig represented in C, with branches colored by cluster.

