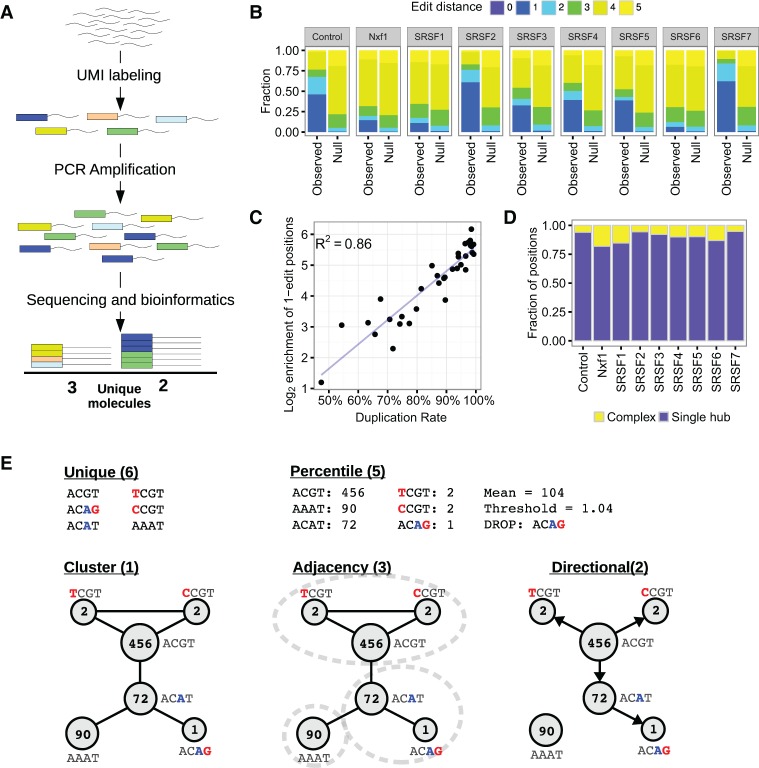
Figure 1.
Modeling errors in UMIs. (A) Schematic representation of how UMIs are used to count unique molecules. Fragmented DNA is labeled with a random UMI sequence (short oligonucleotide; represented as colored blocks). Following PCR amplification, sequencing, and bioinformatics steps, the sequence read alignment coordinates and UMI sequences are used to identify sequence reads originating from the same initial DNA fragment (PCR duplicates) and so count the unique molecules. (B) Average edit distances (rounded to integers) between UMIs with the same alignment coordinates. Genomic positions with a single UMI are not shown. (Null) Null expectation from random sampling of UMIs, taking into account the genome-wide distribution of UMIs. (C) Correlation between duplication rate and enrichment of positions with an average edit distance of 1 for iCLIP data. (D) Topologies of networks formed by joining reads with the same genomic coordinates and UMIs a single edit distance apart. (Single hub) One node connected to all other nodes; (complex) no node connected to all other nodes. (E) Methods for estimating unique molecules from UMI sequences and counts at a single locus. Where the method uses the UMI counts, these are shown. Red bases are inferred to be sequencing errors, and blue bases are inferred to be PCR errors. The inferred number of unique molecules for each method is shown in parentheses.

