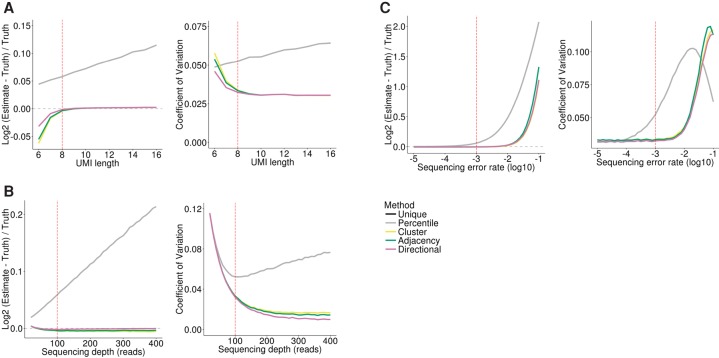
Figure 2.
Comparison of methods with simulated data. In each panel, all but one of the simulation parameters are held constant, with the remaining parameter varied as shown on the x-axis. (A) UMI length. (B) Sequencing depth. (C) Sequencing error rate. The left plots show the accuracy of quantification, presented as the log2-transformed normalized difference between the estimate and ground truth. The right plots show the coefficient of variation (standard deviation/mean). The dashed red line represents the value used for this parameter in all other simulations. The dashed gray line represents perfect accuracy. The unique and percentile methods give identical results with the parameters shown here and are hence overplotted.

