Figure 4.
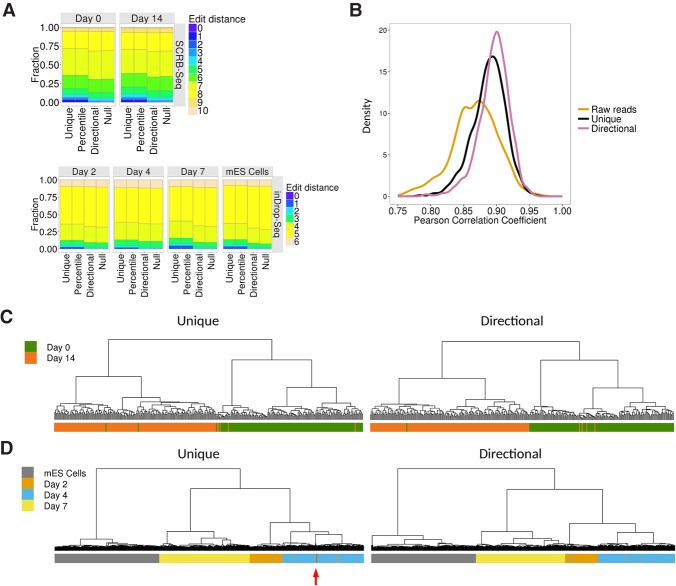
UMI-tools improves accuracy and clustering in single-cell RNA-seq. (A) Average edit distances between UMIs with the same alignment coordinates following removal of PCR duplicates using the methods indicated on the x-axis. Genomic positions with a single UMI are not shown. (Null) Null expectation from random sampling of UMIs, taking into account the genome-wide distribution of UMIs; (top) SCRB-seq; (bottom) inDrop-seq. (B) Distribution of Pearson correlation coefficients between log ERCC concentration and log counts for raw reads (UMIs ignored) and unique and directional methods. (C,D) Hierarchical clustering based on the gene expression estimates obtained using unique and directional. Color bars represent differentiation stage. (C) SCRB-seq. (D) inDrop-DSeq. The red arrow indicates mES cells clustering with Day 4 cells.

