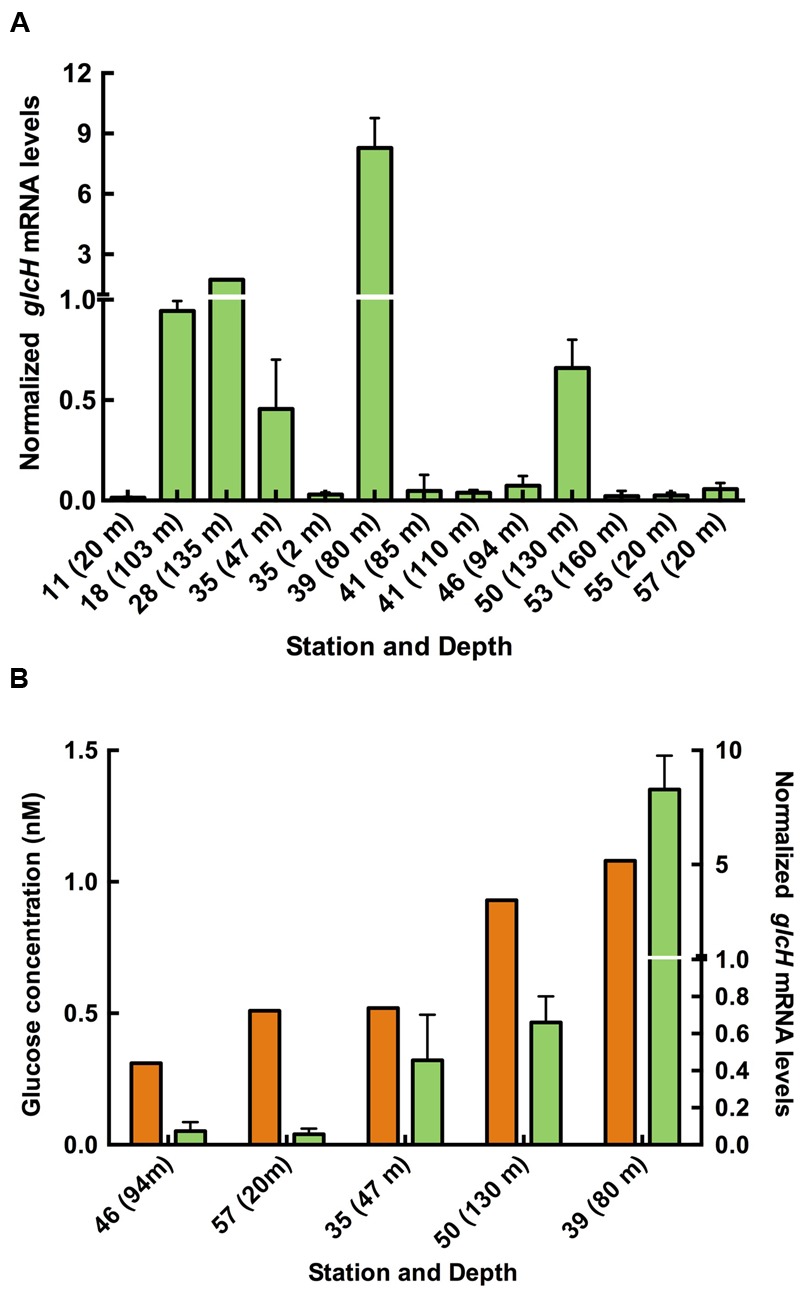
FIGURE 2.

Expression of glcH in natural populations of Prochlorococcus. (A) Relative expression of glcH in natural samples of Prochlorococcus obtained during the AMT-21 cruise. (B) Relationship between the glucose concentration found in the sea (orange) and the glcH expression in natural samples of Prochlorococcus (green). Information on the specific stations of the AMT21 cruise are available in a previous paper (Muñoz-Marín et al., 2013) and in the AMT21 Cruise Report (http://www.amt-uk.org/pdf/AMT21_Cruise_Report.pdf).
