
FIGURE 4.
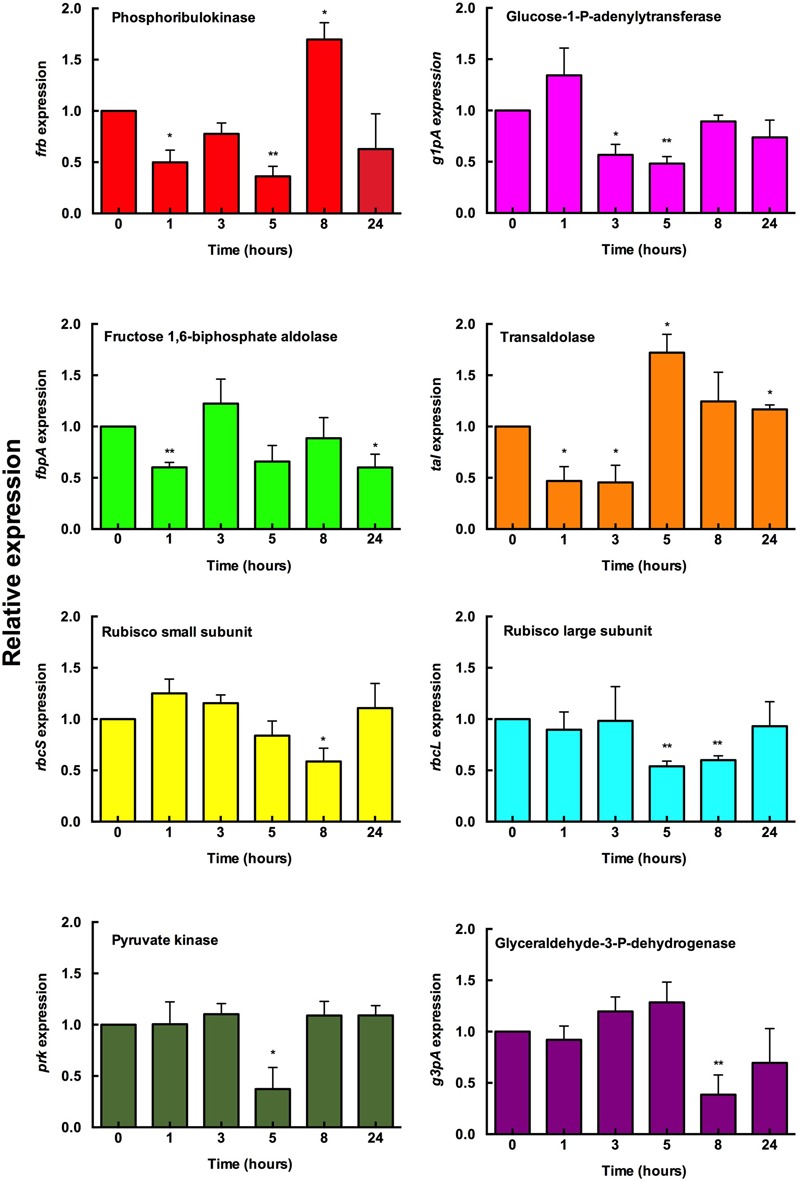
Effect of glucose addition on the gene expression of Prochlorococcus sp. SS120. Glucose (0.1 μM final concentration) was added to Prochlorococcus cultures. Samples were taken at the indicated times and the gene expression measured by real time RT-PCR. Expression level = 1 indicates no changes with respect to the control (no addition). Bars indicate the average of six independent determinations. Error bars show standard deviation for each sample. ∗ Means significant with respect to the samples obtained at T = 0.