FIGURE 5.

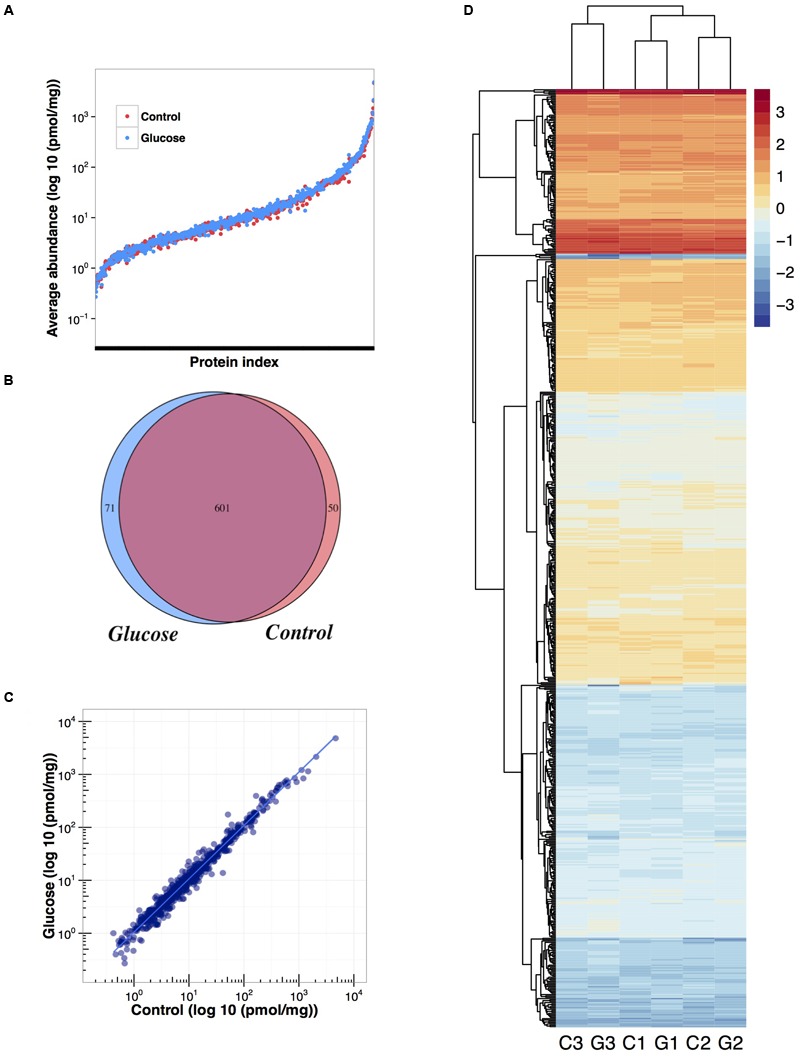
Effect of glucose addition on the proteome of Prochlorococcus sp. SS120: summary of the proteomic analysis. (A) Overlapping average quantification data obtained for each protein in control and glucose treated cultures. (B) Venn diagram showing the number of proteins identified in control and glucose treated cultures. (C) Correlation between the average quantification obtained per protein for control and glucose treated cultures. (D) Heat map of protein expression (log 10) and hierarchical clustering analysis: C1, control condition from biological replicate 1; G1, glucose condition from biological replicate 1; C2, control condition from biological replicate 2; G2, glucose condition from biological replicate 2; C3, control condition from biological replicate 3; G3, glucose condition from biological replicate 3.
