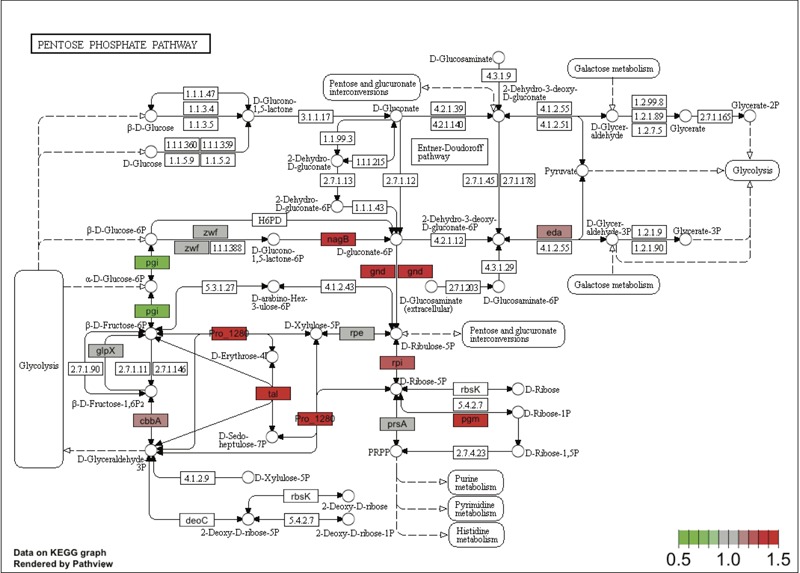
FIGURE 6.

Changes in the concentration of enzymes involved in glucose utilization in Prochlorococcus SS120 upon addition of 0.1 μM glucose. The scheme depicts the main pathways of glucose utilization in Prochlorococcus SS120 using the KEGG database, showing the detected changes in concentration for the different enzymes. Colors show the fold change (glucose/control) obtained from relative quantitation. Red corresponds to upregulation, green to downregulation.
