Fig. 1.
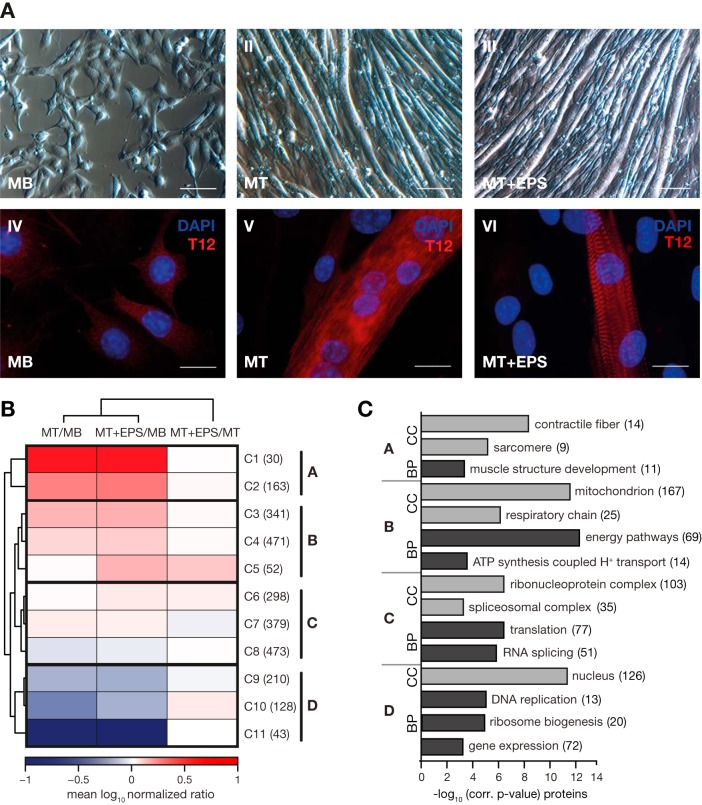
Quantitative proteomic analysis of C2C12 myogenesis. A, Formation of contracting sarcomeres in C2C12 skeletal muscle cells studied by light (I–III) and fluorescence (IV–VI) microscopy. Cell fusion was demonstrated by DAPI staining of nuclei (blue) and sarcomere formation by staining using a T12 antibody (red) directed against the Z-disc-associated end of titin (IV–VI). Mononuclear myoblast (MB) at 50% confluence (I, IV) were grown to 90% confluence before cell fusion was induced by serum reduction. Following 5–6 days of differentiation, cells were fused to polynuclear myotubes (MT) with a diameter of 20–50 μm and a length of up to 1–2 mm (II, V). To generate contracting myotubes, cells were electrically stimulated for 16–24 h (MT+ESP). Sarcomere formation was confirmed by observing the typical striated pattern in fluorescence microscopy (VI); no morphological changes were observed in light microscopy (III). Scale bar: I-III, 100 μm; IV-VI, 10 μm. B, Hierarchical cluster analysis of 2588 proteins quantified at each state of C2C12 differentiation (MB, MT, MT+EPS) in at least two out of three biological replicates. Mean protein ratios were log10 transformed. K-means cluster analysis revealed 11 clusters which were further grouped to four main clusters: cluster A (C1 and C2), B (C3-C5), C (C6-C8), and D (C9-C11). C, GO-term enrichment analysis of proteins grouped in the main cluster A–D. p values after Benjamini-Hochberg false discovery rate (FDR < 0.05) correction were plotted against their corresponding GO-terms from the domains “cellular component” (CC) and “biological process” (BP). Numbers of identified proteins for each GO term are shown in brackets.

