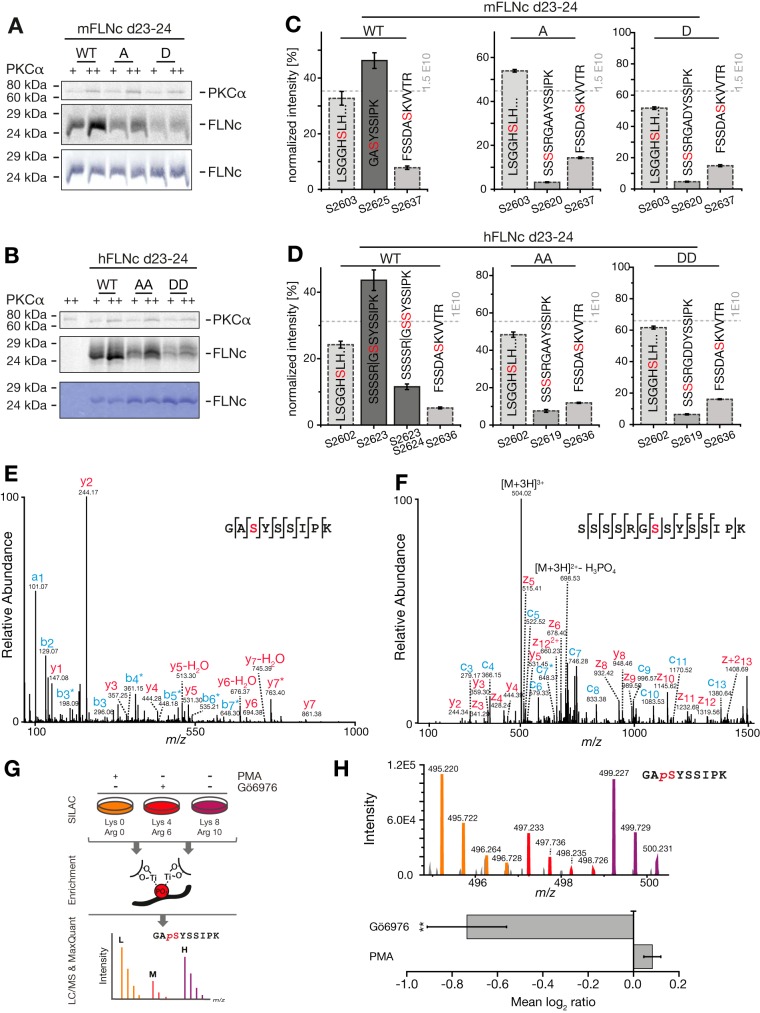
Fig. 4.
S2625 and S2623/S2624 are the specific substrates sites of PKCα in the hinge 2 region of mFLNC and hFLNc, respectively. A, B, Radioactive in vitro kinase assays. Recombinant wildtype and phosphosite mutants of mouse (A) and human (B) FLNc Ig-like domains 23–24 (d23–24) were treated with PKCα in the presence of (γ-33P]ATP and analyzed by SDS-PAGE followed by autoradiography or Coomassie staining. S2625 of mFLNC d23–24 was replaced by A or D; S2623/S2624 of hFLNC d23–24 by AA or DD. As a control, PKCα was incubated in (γ-33P)ATP-containing kinase buffer without hFLNc d23–24 (B). WT, wildtype; A, alanine; D, aspartate; +, 10 ng PKCα; ++, 20 ng PKCα. C, D, MS-based in vitro kinase assays. Reactions were performed as described in (A, B) using unlabeled ATP and PKCα. MS data from three independent kinase experiments for mFLNc d23–24 WT, A and D sites mutants (C) and hFLNc WT, AA, and DD site mutants (D) were quantified. Intensities of phosphopeptides distinctive for a specific phosphorylation site (red) were added up per experiment and represented as normalized mean ± S.E. E, F, Fragmentation spectra of mono-phosphorylated peptides of mouse (E) and human (F) FLNc d23–24 WT forms. PKCα-dependent phosphorylation of mFLNc-S2625 and hFLNc-S2623 was determined by higher-collisional dissociation and electron transfer dissociation, respectively. Fragment ions exhibiting a neutral loss of phosphoric acid (H3PO4; 97.9768 u) are marked with an asterisk (*); loss of water (H2O) as indicated. Phosphorylated residues are depicted in red; b/c- and y/z-ion series in red and blue, respectively. G, Experimental workflow to study mouse FLNc S2625 phosphorylation in C2C12 myotubes by SILAC and quantitative MS. Three biological replicates were performed including label-swaps. H, Changes in the phosphorylation of mouse FLNc S2625 in C2C12 myotubes treated with PMA or Gö6976 in comparison to control. Top: SILAC triplet of the mouse FLNc phosphopeptide 2623GApSYSSIPK2631. Bottom: Relative quantification of the mouse FLNc phosphopeptide 2623GApSYSSIPK2631 using Skyline. Shown is the mean log2 ratio of the area under the curve ± S.E. **p ≤ 0.006, n = 3.

