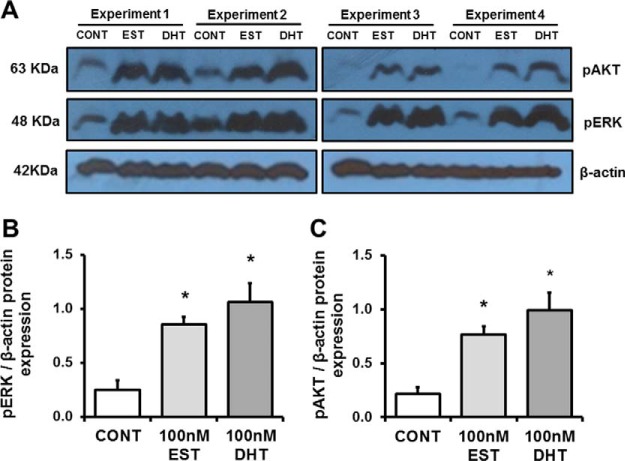
Fig. 2.
Control experiments. A, shows a representative Western blot demonstrating phosphorylation of AKT and ERK after stimulation with EST and DHT, but not in cells exposed to ethanol alone (CONT). Densitometry analysis of each band was performed using Image J software. Intensities for pERK (B) and pAKT (C) were calculated and normalized to β-actin. Data are expressed as means ± S.E. *p < 0.05 compared with control cells.

