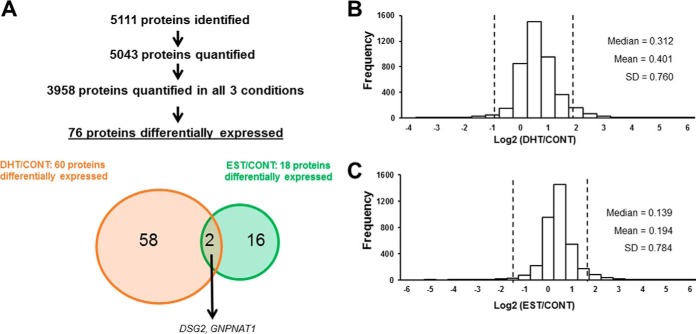
Fig. 3.
Identified, quantified and differentially expressed proteins in our spike-in SILAC approach. The scheme illustrates the number of identified and quantified proteins, followed by a Venn diagram representing the number and overlap of significantly regulated proteins according to significance A for DHT/CONT and EST/CONT ratio values (A). Histograms depicting the distributions of Log2 transformed DHT/CONT (B) and EST/CONT (C) ratios are shown. Vertical lines represent 1.96·S.D.

