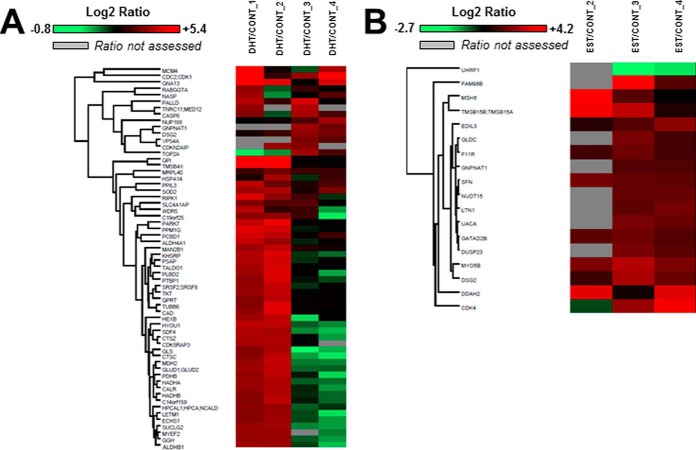
Fig. 4.
Heat map representation of sex-regulated proteins in PTEC. Heat maps were constructed using Perseus software and reflect the value of Log2 transformed normalized DHT/CONT (A) and EST/CONT (B) ratios for each individual protein (rows) in each experiment (columns). The color intensity of red and green boxes correlates with the degree of protein over- and under expression, respectively. A gray box indicates that the ratio was not assessed for that particular protein in that particular experiment.

