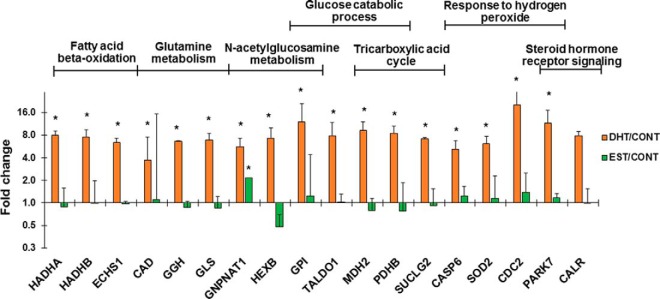
Fig. 5.
Enriched biological processes among the 60 proteins differentially regulated by DHT. Bar graphs illustrating the Log2 transformed DHT/CONT and EST/CONT ratios of several DHT-regulated proteins involved in the most representative, informative and significantly enriched biological processes according to gene ontology analysis using BinGO plugin in Cytoscape. An asterisk indicate that these protein was significant by significance A with p < 0.01 in at least 2 experiments.

