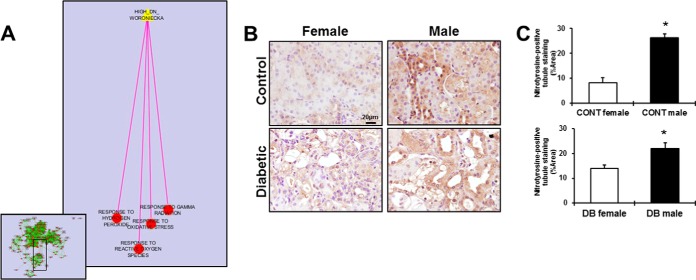
Fig. 9.
Functional enrichment of oxidative stress among our DHT-regulated proteins. The enrichment map (EM) was constructed imposing our list of DHT-regulated proteins to a renal transcriptomic data set from human diabetic kidneys in Cytoscape (A). EM is depicted in the left bottom, in the panel. Each circle represents an enriched GO term, with red color indicating significance. Green edges indicate that up-regulated proteins are shared by the two GO terms they connect. The analysis revealed that functional groups associated with oxidative stress (A) were shared with our data set. The pink edge represents overlap between the target gene set and the enriched biological processes from our experiment. To validate the link between male sex and renal oxidative stress, nitrotyrosine immunostaining was used to evaluate superoxide and peroxynitrite levels in kidney sections from female and male, control and STZ-diabetic mice (B). Scale Bar = 20 μm. Original magnification ×40. Brown-stained areas were quantified with ImageJ software (C). Data are expressed as means ± S.E. of positive area fraction (%). *p < 0.05 compared with females.

