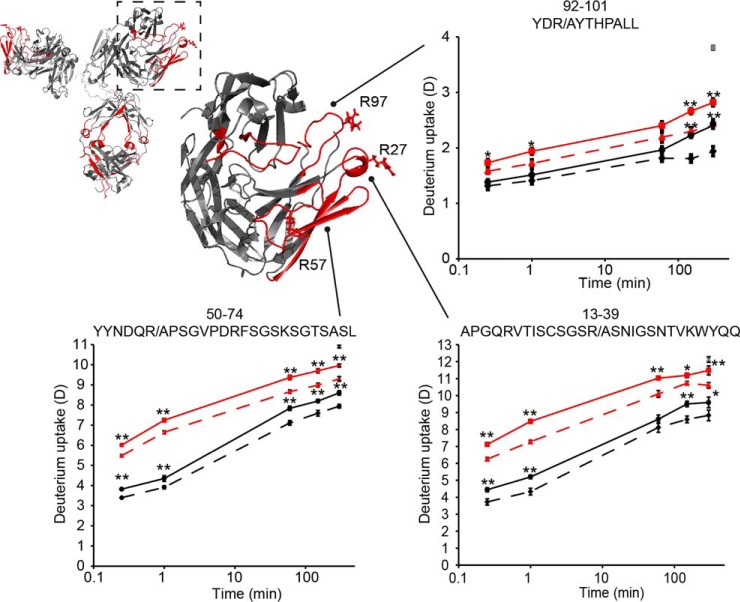
Fig. 1.
Conformational stabilization of Fab peptides revealed by HDX-MS. Homology model of briakinumab with a zoomed view of one Fab arm with residues R27, R57 and R97 shown. In the zoomed view, regions with no difference in HDX in unbound and FcRn bound IgG are shown in gray, regions showing reduced HDX upon FcRn binding are shown in red and regions without coverage are shown in white. Deuterium uptake plots show HDX curves of briakinumab (black), briakinumab variant (red) without (bold line) and with FcRn (dashed line). Deuterium incorporation was determined in triplicates in a time range from 15 s to 5 h labeling of unbound or FcRn-bound IgG. The fully deuterated control of briakinumab is shown (gray star) at the last time point. **: p < 0.01, *: p < 0.05 indicate the level of significance between of the deuterium uptake of IgG in the absence and presence of FcRn.

