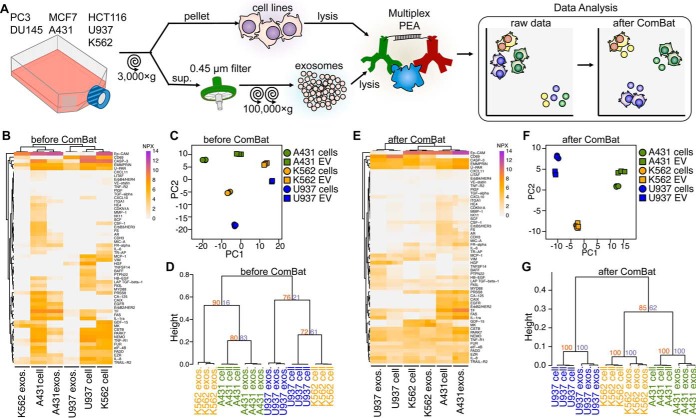
Fig. 1.
Cell line derived exosome protein patterns cluster with their originating cell lysates. A, Schematic illustration of the experimental setup. Exosomes were isolated from seven cell lines, and, together with the corresponding cell lysates, subjected to multiplex PEA. B, Heatmap of protein patterns of lysates from the A431, K562 and U937 cell lines and from their respective exosomes. C, PCA of cell lysates and exosomes. D, Hierarchical clustering of cell lysate and their corresponding exosomes. E, Heatmap (F) PCA plot and (G) hierarchical clustering of proteins in lysates from cells and their corresponding exosomes after removal of cell- and exosome-specific proteins using the ComBat analyses, resulting in analyses of only proteins shared by both sample types. For dendrograms, heights represent dissimilarity among clusters and numbers on the plots indicate approximate unbiased p values (orange) and bootstrap probability (purple). Three to five biological replicates were analyzed for each sample type.

