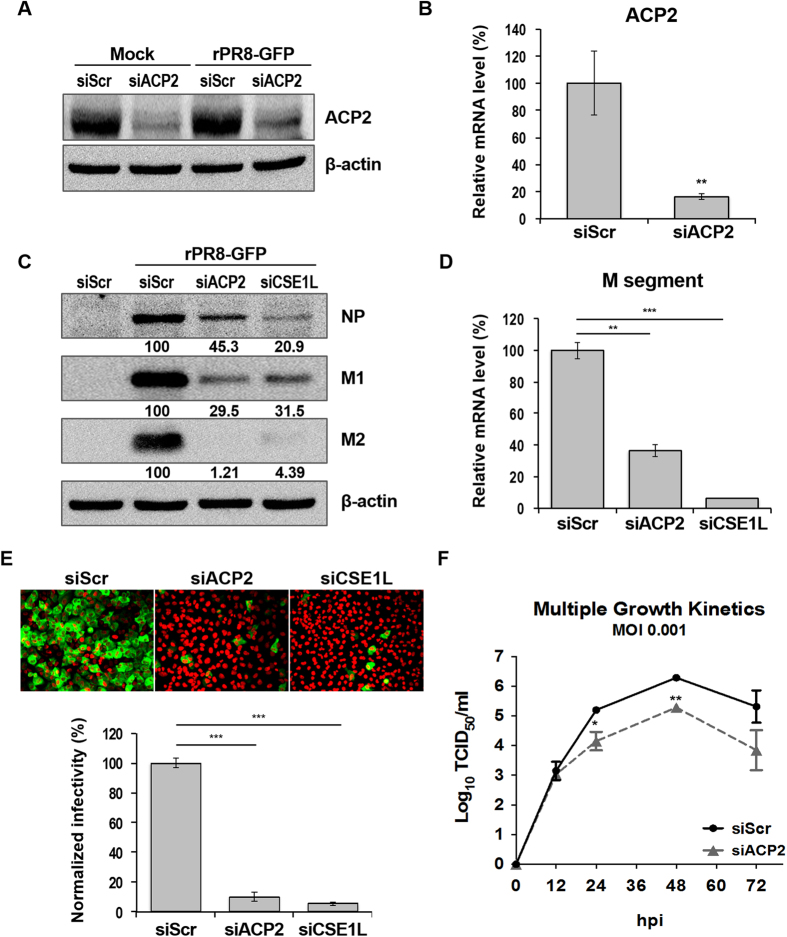
Figure 2. ACP2 depletion inhibits IAV infection.
(A) Reduction of ACP2 protein expression by siACP2 in both non-infected and infected cells. A549 cells were transfected with indicated siRNAs. After 48 hours, cells were infected with rPR8-GFP virus or not (Mock) for 10 hours and then subject to western blot analyses using the anti-ACP2 and anti-β-actin antibodies. (B) Reduced ACP2 mRNA levels in siACP2-transfected cells. (C) Viral protein expression in ACP2-depleted cells. A549 cells were transfected with indicated siRNAs for 48 hours. Cells were then infected with the rPR8-GFP virus at an MOI of 1. After 10 hours, cells were lysed and subject to western blot analyses using the anti-ACP2, anti-NP, anti-M2, anti-M1, and anti-β-actin antibodies. The band density was quantified by Image J software. All values are relative to those of cells transfected with siScr. (D) Reduced viral mRNA levels upon ACP2 depletion. A549 cells were transfected with siACP2, siScr, or siSCE1L as indicated prior to infection with rPR8-GFP virus at an MOI of 1. After 10 hours, total RNA was extracted and subject to qRT-PCR. Mean mRNA expression was normalized to that of siScr-transfected cells using the 2ΔCt method. Means from triplicate experiments are given. Error bars represent ± SD. (E) ACP2 depletion reduced GFP expression in cells infected with rPR8-GFP virus. A549 cells were transfected for 48 hours with the indicated siRNAs, before infection with the rPR8-GFP virus at an MOI of 1. After 10 hours, cells were fixed and observed with a microplate imaging reader. Quantification of GFP-positive cells was normalized to that of the siScr-transfected cells. Bars show means ± SD from quadruplicated experiments. (F) Viral particle production was impeded by ACP2 depletion. A549 cells were transfected with indicated siRNAs for 48 hours before infection with the rPR8-GFP virus at an MOI of 0.001. Supernatant from the infected cells was collected at 12, 24, 48, and 72 hours post-infection. Viral titer was determined by TCID50 assays on MDCK cells. Data are represented as the mean ± SD of three independent experiments. Statistical significance between the indicated groups was tested using the Student’s t-test; *p < 0.05; **p < 0.01; ***p < 0.001.

