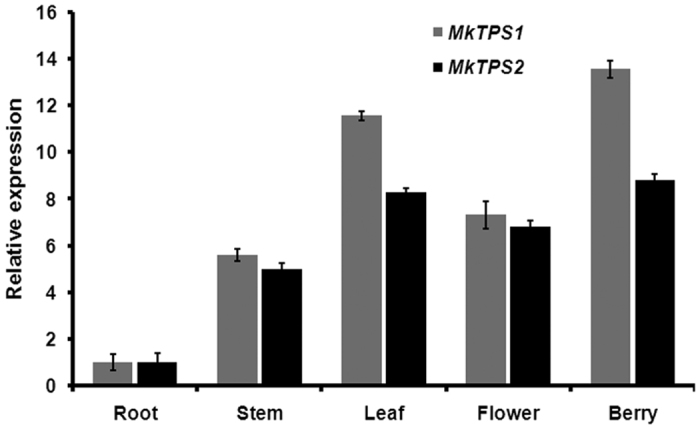
Figure 8. Tissue specific expression of MkTPS1 and MkTPS2.

Real-time qPCR expression analysis of MkTPS1 and MkTPS2 in different tissues of curry tree. Actin was used as the endogenous control. The expression of root was set to 1 to determine the relative abundance in other tissues.
