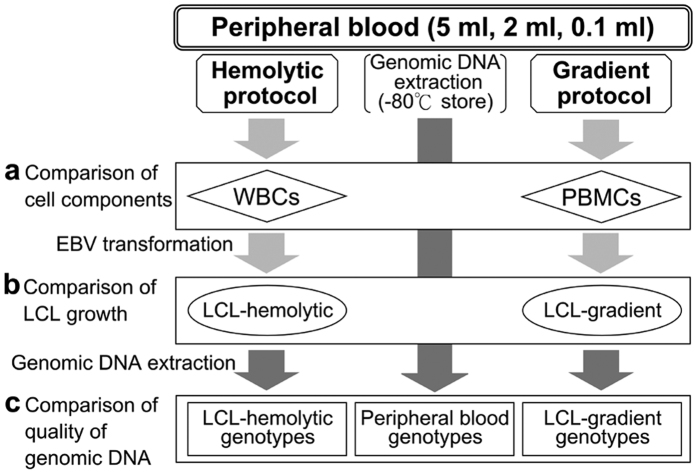
Figure 1. Study design for the comparative experiments.
To evaluate the efficiency and reliability of the hemolytic protocol (flowchart, left side), a quantitative comparison was made with the gradient protocol (flowchart, right side) by changing the starting blood volume (5 ml, 2 ml, or 0.1 ml) with respect to the following three categories: (a) Comparison of the features of the cells (cell recovery, viability, and proportion of cell components) of the isolated WBCs prepared by the hemolytic protocol or PBMCs prepared by the gradient protocol, (b) Comparison of the growth curves of establishing LCLs (ellipse) from WBCs (LCL-hemolytic) or PBMCs (LCL-gradient), and (c) Comparison of the quality of genomic DNA (rectangle) based on the SNP genotype data (central arrow).

