
Figure 2. Growth curve of LCLs established from different blood volumes.
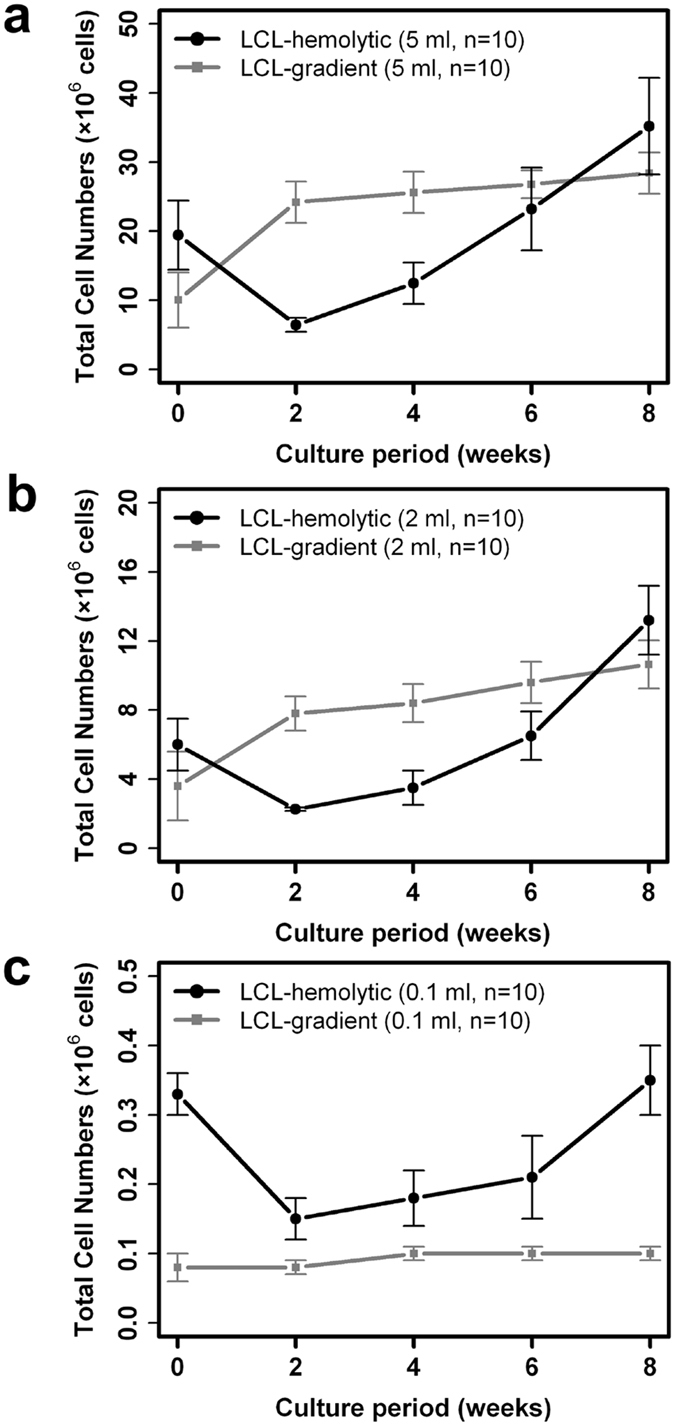
The LCLs were established by either hemolytic (LCL-hemolytic, solid black circle) or gradient (LCL-gradient, solid gray square) protocol from the peripheral blood of 5 ml (a), 2 ml (b), or 0.1 ml (c). Each LCL was cultured until 8 weeks and observed at 2-week intervals. Each point indicates the average and standard error bar of 10 LCLs. The vertical axis indicates the total number of viable cells and the horizontal axis indicates the weeks post EBV infection.