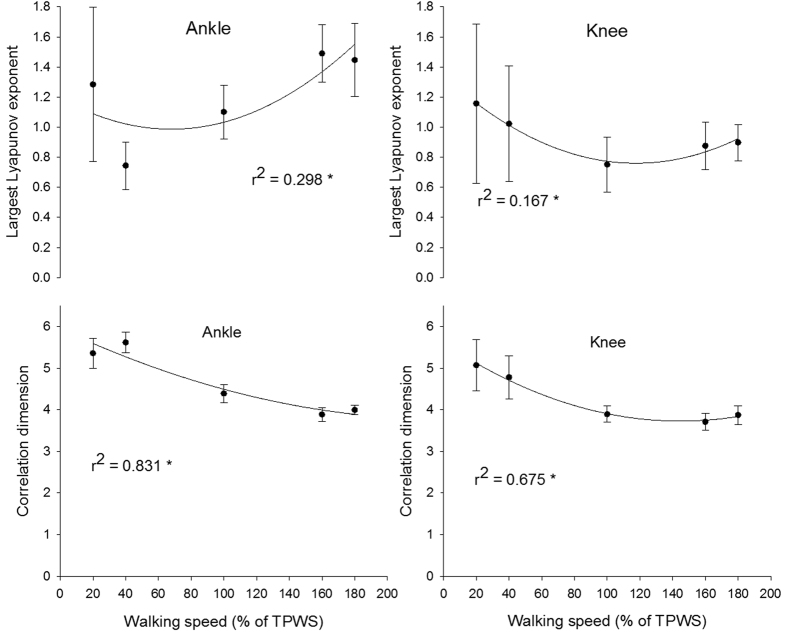
Figure 3. Largest Lyapunov exponent and correlation dimension of the ankle and knee joint angle.
Error bars indicate between-subject standard deviation. Curve fit lines represent quadratic polynomial regression curves with r2 values indicate the percent of variance accounted for by each regression model. *Indicates significant quadratic relationship between walking speed and variable.

