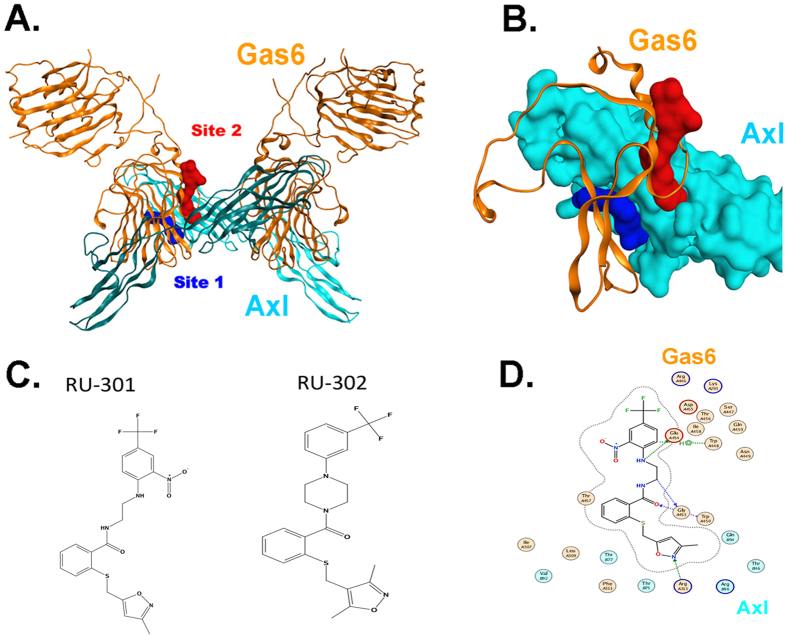
Figure 1. Molecular representation of drug targetable region in Axl-Gas6 complex, from RCSB PDB-2C5D.
(A) Ribbon model depicting the targetable interfaces (in space filling) between Gas6 (orange) and Axl-Ig1 (cyan), with magnification of two targetable sites: Site 1 (blue space filling) and Site 2 (red space filling). (B) Inset of the detailed targetable interfaces between Gas6 and Axl from panel A. (C) Structures of RU-301 and RU-302 (D) Putative docking pose of RU-301 in Site 2, lined by contact residues in Gas6 (orange) and Axl (cyan).

