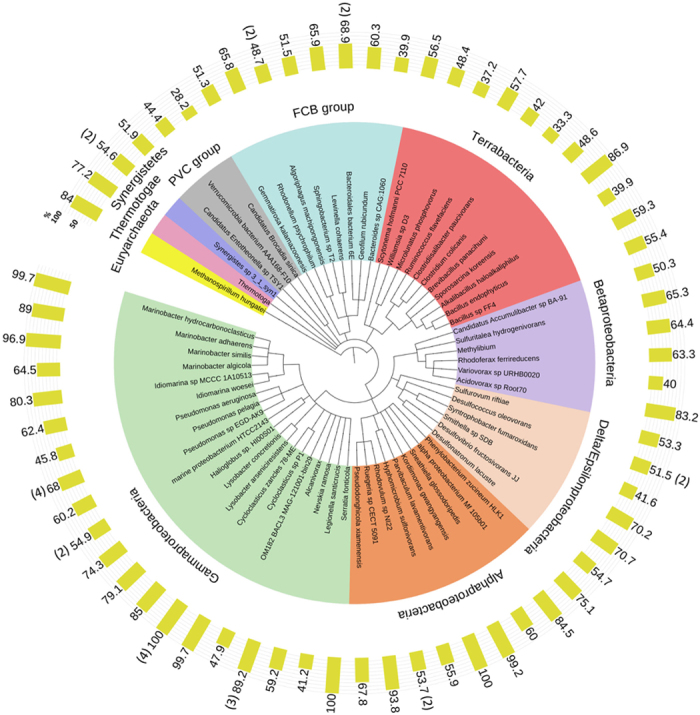
Figure 2. Phylogenetic distribution of 80 metagenomic carboxylesterases and their top sequence homologues across the tree of life.

The numbers on yellow bars show sequence identity (%) of metagenomic esterases to protein sequences from indicated organisms. For organisms/genera with more than one metagenome esterase homologue, the means are indicated (with the number of esterases shown in brackets).
