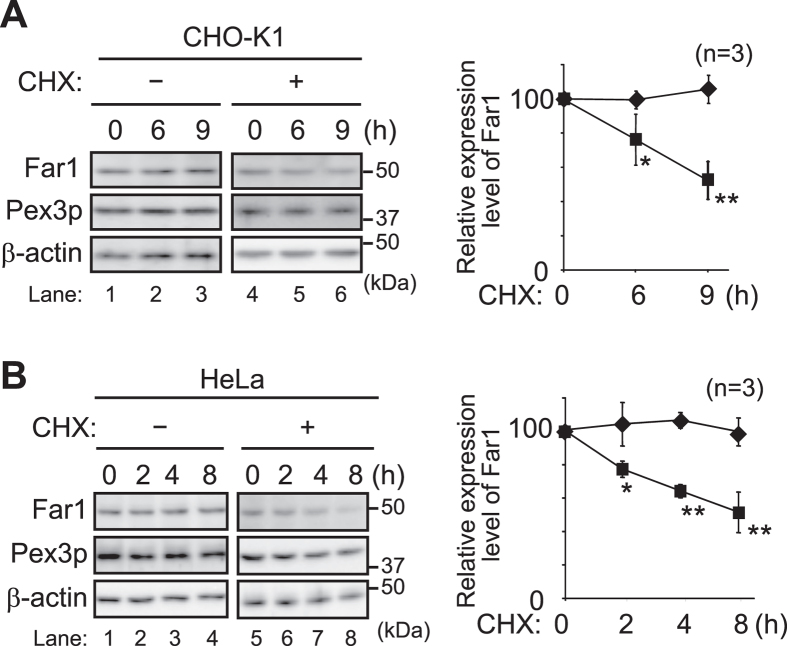
Figure 1. Plasmalogen-iduced degradation of Far1 in wild-type cells.
CHO-K1 (A) and HeLa (B) cells were cultured in the presence (+) or absence (−) of CHX for the indicated time. Expression level of Far1 at each time point in the absence (diamond) or presence (square) of CHX was assessed. Peroxisomal membrane protein Pex3p and β–actin for a loading control were detected with respective specific antibodies (left panels). Molecular masses were indicated on the right, using the migration of standard mass markers. Relative amounts of Far1 at each time point were represented by taking as 100 those at the time point of CHX addition in respective cells (right panels). *p < 0.05, **p < 0.01; Student’s t test compared with the expression level of Far1 at each time point in the absence of CHX. Data of unprocessed original blots are available in Supplementary Fig. S2.

