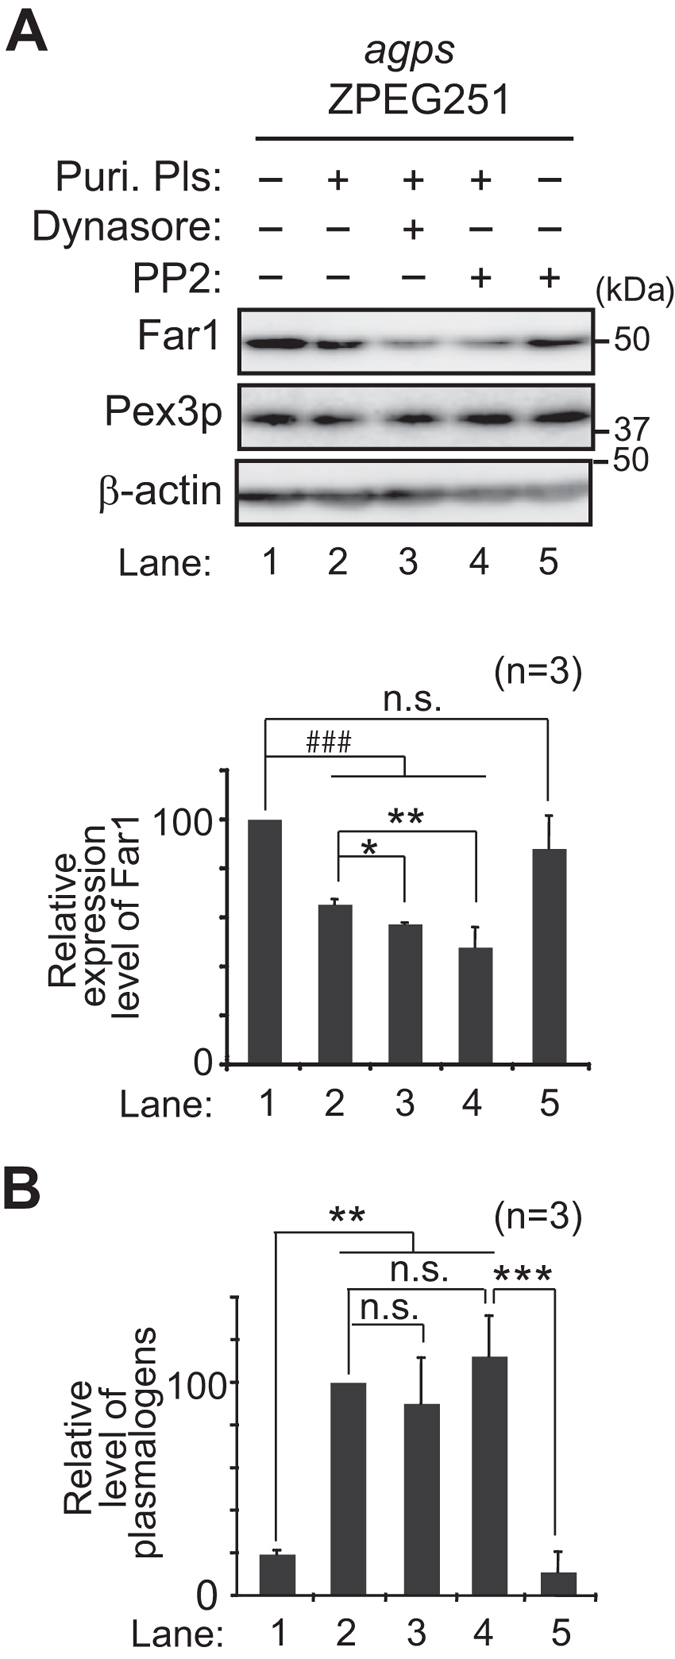
Figure 4. Src family kinase inhibitor PP2 induces degradation of Far1.

(A) agps ZPEG251 was cultured in the presence (lanes 2–4) or absence (lanes 1 and 5) of purified plasmalogens (puri. Pls) for 6 h, and further cultured in the presence of Dynasore (lane 3) or PP2 (lanes 4 and 5) for 5 h. Expression levels of Far1 were assessed by immunoblotting (upper panel) and represented (lower panel) by taking as 100 that in ZPEG251 (lane 1). ###p < 0.001; one-way ANOVA with Dunnett’s post hoc test as compared with mock-treated cells. n.s., not significant. *p < 0.05 and **p < 0.01; one-way ANOVA with Dunnett’s post hoc test as compared with ZPEG251 treated with purified plasmalogens (lane 2). (B) Cellular plasmalogens were analysed by LC-ESI-MS/MS and represented by taking as 100 that in ZPEG251 cultured in the presence of purified plasmalogens (lane 2). **p < 0.01 and ***p < 0.001; one-way ANOVA with Tukey post hoc test as compared with ZPEG251. n.s., not significant. Data of unprocessed original blots are available in Supplementary Fig. S2.
