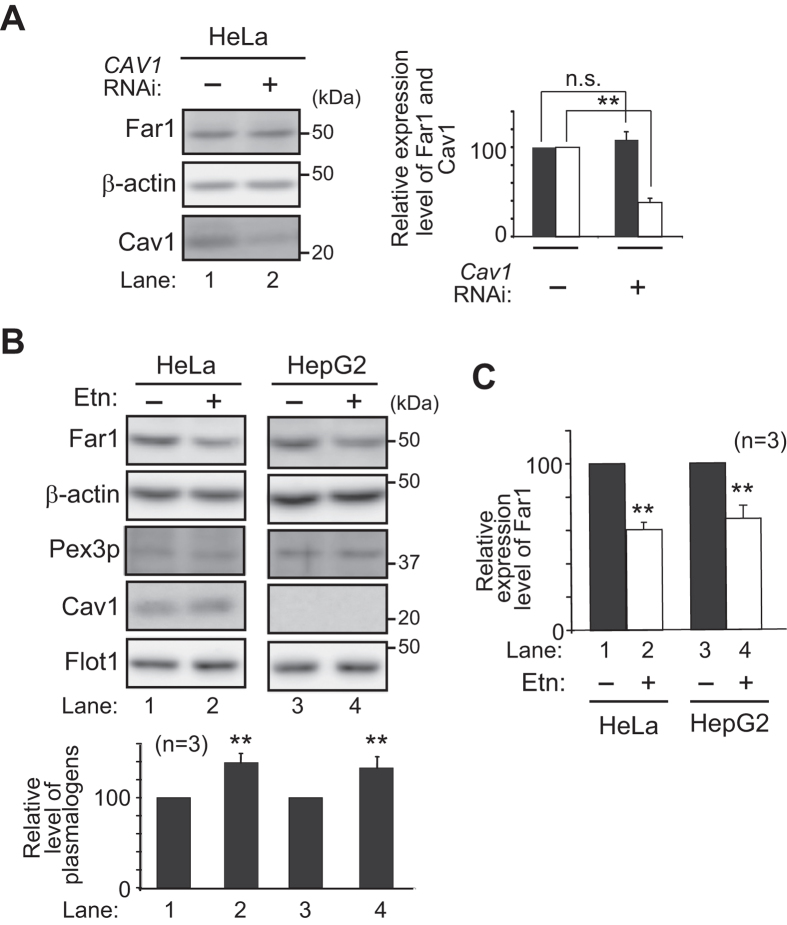
Figure 6. Far1 is degraded in the absence of caveolae.
(A) Expression levels of Far1 (solid bar) and Cav1 (open bar) were assessed in HeLa cells transfected with dsRNAs against CAV1. β–actin was used as a loading control. Expression level of Far1 was represented by taking as 100 that in mock-treated cell (right panel). **p < 0.01; t test versus mock-treated cells. n.s., not significant. (B) HeLa and HepG2 were cultured in the presence of Etn (5 μM) for 48 h and assessed for expression level of Far1, β–actin, Pex3p, Cav1, and Flo1. Note that Cav1 is not expressed in HepG2 cells35. Cellular plasmalogens were analysed by LC-ESI-MS/MS and represented by taking those as 100 in mock-treated respective cells. **p < 0.01; t test versus mock-treated respective cells. (C) Expression level of Far1 was represented by taking those as 100 in mock-treated respective cells. **p < 0.01; t test versus mock-treated respective cells. Data of unprocessed original blots are available in Supplementary Fig. S2.

